wgsl-analyzer
At its core, wgsl-analyzer is a library for semantic analysis of WGSL and WESL code as it changes over time.
This manual focuses on a specific usage of the library - running it as part of a server that implements the Language Server Protocol (LSP).
The LSP allows various code editors, such as VS Code, Emacs, or Vim to implement semantic features such as completion or goto definition by talking to an external language server process.
To improve this document, send a pull request: https://github.com/wgsl-analyzer/wgsl-analyzer.
The manual is written in markdown and includes some extra files which are generated from the source code.
Run cargo test and cargo xtask codegen to create these.
If you have a question about using wgsl-analyzer, please read the documentation.
If your question is not addressed, then ask it in the "discord".
Ideally, the documentation should address all usage questions.
Installation
To use wgsl-analyzer, you need a wgsl-analyzer binary and a text editor that supports LSP.
If you are using VS Code, the extension bundles a copy of the wgsl-analyzer binary.
For other editors, you will need to install the binary and configure your editor.
Crates
There is a package named wa_ap_wgsl-analyzer available on crates.io for people who want to use wgsl-analyzer programmatically.
For more details, see the publish workflow.
VS Code
This is the best supported editor at the moment.
The wgsl-analyzer plugin for VS Code is maintained in-tree.
You can install the latest release of the plugin from the marketplace.
The server binary is stored in the extension install directory, which starts with wgsl-analyzer.wgsl-analyzer- and is located in:
- Linux:
~/.vscode/extensions - Linux (Remote, such as WSL):
~/.vscode-server/extensions - macOS:
~/.vscode/extensions - Windows:
%USERPROFILE%\.vscode\extensions
As an exception, on NixOS, the extension makes a copy of the server and stores it in ~/.config/Code/User/globalStorage/wgsl-analyzer.wgsl-analyzer.
Note that we only support the two most recent versions of VS Code.
Updates
The extension will be updated automatically as new versions become available. It will ask your permission to download the matching language server version binary if needed.
Nightly
We ship nightly releases for VS Code. To help us out by testing the newest code, you can enable pre-release versions in the Code extension page.
Manual installation
Alternatively, download a VSIX corresponding to your platform from the releases page.
Install the extension with the Extensions: Install from VSIX command within VS Code, or from the command line via:
code --install-extension /path/to/wgsl-analyzer.vsix
If you are running an unsupported platform, you can install wgsl-analyzer-no-server.vsix and compile or obtain a server binary.
Copy the server anywhere, then add the path to your settings.json.
For example:
{ "wgsl-analyzer.server.path": "~/.local/bin/wgsl-analyzer-linux" }
Building From Source
Both the server and the Code plugin can be installed from source:
git clone https://github.com/wgsl-analyzer/wgsl-analyzer.git && cd wgsl-analyzer
cargo xtask install
You will need Cargo, Node.js (matching a supported version of VS Code) and npm for this.
Note that installing via xtask install does not work for VS Code Remote.
Instead, you will need to install the .vsix manually.
If you are not using Code, you can compile and install only the LSP server:
cargo xtask install --server
Make sure that .cargo/bin is in $PATH and precedes paths where wgsl-analyzer may also be installed.
VS Code or VSCodium in Flatpak
Setting up wgsl-analyzer with a Flatpak version of Code is not trivial because of the Flatpak sandbox. This prevents access to files you might want to import.
wgsl-analyzer Binary
Text editors require the wgsl-analyzer binary to be in $PATH.
You can download pre-built binaries from the releases page.
You will need to uncompress and rename the binary for your platform.
For example, on Mac OS:
- extract
wgsl-analyzer-aarch64-apple-darwin.gztowgsl-analyzer - make it executable
- move it into a directory in your
$PATH
On Linux, to install the wgsl-analyzer binary into ~/.local/bin, these commands should work:
mkdir -p ~/.local/bin
curl -L https://github.com/wgsl-analyzer/wgsl-analyzer/releases/latest/download/wgsl-analyzer-x86_64-unknown-linux-gnu.gz | gunzip -c - > ~/.local/bin/wgsl-analyzer
chmod +x ~/.local/bin/wgsl-analyzer
Make sure that ~/.local/bin is listed in the $PATH variable and use the appropriate URL if you are not on a x86-64 system.
You do not have to use ~/.local/bin, any other path like ~/.cargo/bin or /usr/local/bin will work just as well.
Alternatively, you can install it from source using the command below. You will need the latest stable version of the Rust toolchain.
git clone https://github.com/wgsl-analyzer/wgsl-analyzer.git && cd wgsl-analyzer
cargo xtask install --server
If your editor cannot find the binary even though the binary is on your $PATH, the likely explanation is that it does not see the same $PATH as the shell.
On Unix, running the editor from a shell or changing the .desktop file to set the environment should help.
Arch Linux
The wgsl-analyzer binary can be installed from the repos or AUR (Arch User Repository):
-
wgsl-analyzer(built from latest tagged source) -
wgsl-analyzer-git(latest Git version)
Install it with pacman, for example:
pacman -S wgsl-analyzer
Gentoo Linux
macOS
The wgsl-analyzer binary can be installed via Homebrew.
brew install wgsl-analyzer
Windows
The wgsl-analyzer binary can be installed via WinGet or Chocolatey.
winget install wgsl-analyzer
choco install wgsl-analyzer
Other Editors
wgsl-analyzer works with any editor that supports the Language Server Protocol.
This page assumes that you have already installed the wgsl-analyzer binary.
Emacs (using lsp-mode)
- Assumes you are using
wgsl-mode: https://github.com/acowley/wgsl-mode
-
Install the language server
cargo install --git https://github.com/wgsl-analyzer/wgsl-analyzer wgsl-analyzer -
Add the following to your init.el
(with-eval-after-load 'lsp-mode
(add-to-list 'lsp-language-id-configuration '(wgsl-mode . "wgsl"))
(lsp-register-client (make-lsp-client :new-connection (lsp-stdio-connection "wgsl-analyzer")
                                      :activation-fn (lsp-activate-on "wgsl")
                                      :server-id 'wgsl-analyzer)))
Eglot
Eglot is the more minimalistic and lightweight LSP client for Emacs, integrates well with existing Emacs functionality and is built into Emacs starting from release 29.
After installing Eglot, e.g. via M-x package-install (not needed from Emacs 29), you can enable it via the M-x eglot command or load it automatically in wgsl-mode via
(add-hook 'wgsl-mode-hook 'eglot-ensure)
For more detailed instructions and options see the Eglot manual (also available from Emacs via M-x info) and the Eglot readme.
Eglot does not support the wgsl-analyzer extensions to the language-server protocol and does not aim to do so in the future.
The eglot-x package adds experimental support for those LSP extensions.
LSP Mode
LSP-mode is the original LSP-client for emacs. Compared to Eglot it has a larger codebase and supports more features, like LSP protocol extensions. With extension packages like LSP UI it offers a lot of visual eyecandy. Further it integrates well with DAP mode for support of the Debug Adapter Protocol.
You can install LSP-mode via M-x package-install and then run it via the M-x lsp command or load it automatically in WGSL/WESL buffers with
(add-hook 'wgsl-mode-hook 'lsp-deferred)
For more information on how to set up LSP mode and its extension package see the instructions in the LSP mode manual.
Also see the wgsl-analyzer section for wgsl-analyzer specific options and commands, which you can optionally bind to keys.
Vim/Neovim
There are several LSP client implementations for Vim or Neovim:
Using coc-wgsl-analyzer
-
Install coc.nvim by following the instructions at coc.nvim (Node.js required)
-
Run
:CocInstall coc-wgsl-analyzerto installcoc-wgsl-analyzer, this extension implements most of the features supported in the VS Code extension:- automatically install and upgrade stable/nightly releases
- same configurations as VS Code extension,
wgsl-analyzer.server.path,wgsl-analyzer.cargo.featuresetc. - same commands too,
wgsl-analyzer.analyzerStatus,wgsl-analyzer.ssretc. - inlay hints for variables and method chaining, Neovim Only
[!NOTE]
coc-wgsl-analyzeris capable of installing or updating thewgsl-analyzerbinary on its own.
[!NOTE] for code actions, use
coc-codeaction-cursorandcoc-codeaction-selected;coc-codeactionandcoc-codeaction-lineare unlikely to be useful.
Using LanguageClient-neovim
-
Install LanguageClient-neovim by following the instructions
- The GitHub project wiki has extra tips on configuration
-
Configure by adding this to your Vim/Neovim config file (replacing the existing WGSL or WESL-specific line if it exists):
let g:LanguageClient_serverCommands = {
\ 'wgsl': ['wgsl-analyzer'],
\ 'wesl': ['wgsl-analyzer'],
\ }
Using lsp
-
Install the
wgsl-analyzerlanguage server -
Configure the
.wgsland.weslfiletypeCreate
/ftdetect/wgsl.luaand/ftdetect/wesl.luain your neovim configuration.vim.api.nvim_create_autocmd({ "BufRead", "BufNewFile" }, { pattern = "*.wgsl", command = "setfiletype wgsl" })vim.api.nvim_create_autocmd({ "BufRead", "BufNewFile" }, { pattern = "*.wesl", command = "setfiletype wesl" }) -
Configure the nvim lsp
local lspconfig = require('lspconfig')
lspconfig.wgsl_analyzer.setup({})
Using coc.nvim
- Requires CoC to be installed: https://github.com/neoclide/coc.nvim
- Requires cargo to be installed to build binaries:
-
Install the language server
cargo install --git https://github.com/wgsl-analyzer/wgsl-analyzer.git wgsl-analyzer(if you are not familiar with using and setting up cargo, you might run into problems finding your binary. Ensure that $HOME/.cargo/bin is in your $PATH. More Info about $PATH: https://linuxconfig.org/linux-path-environment-variable)
-
open Neovim / Vim and type
:CocConfigto configure coc.nvim. -
under
.languageserver: { ... }create a new field"wgsl-analyzer-language-server". The field should look like this:// { // "languageserver": { "wgsl-analyzer-language-server": { "command": "wgsl-analyzer", // alternatively you can specify the absolute path to your binary. "filetypes": ["wgsl", "wesl"], }, // ... // } -
In order for your editor to recognize WGSL files as such, you need to put this into your
vim.rc" Recognize wgsl au BufNewFile,BufRead *.wgsl set filetype=wgsl
Using nvim-cmp/cmp_nvim_lsp
Requires nvim-cmp and cmp_nvim_lsp.
-
Your existing setup should look similar to this:
local capabilities = vim.lsp.protocol.make_client_capabilities() capabilities = vim.tbl_deep_extend("force", capabilities, require("cmp_nvim_lsp").default_capabilities()) local lspconfig = require("lspconfig") -
Pass capabilities to the
wgsl-analyzersetup:lspconfig.wgsl_analyzer.setup({ filetypes = { "wgsl", "wesl" }, capabilities = capabilities, })
YouCompleteMe
Install YouCompleteMe by following the instructions.
wgsl-analyzer is the default in ycm, it should work out of the box.
ALE
To use the LSP server in ale:
let g:ale_linters = {'wgsl': ['analyzer'], 'wesl': ['analyzer']}
nvim-lsp
Neovim 0.5 has built-in language server support.
For a quick start configuration of wgsl-analyzer, use neovim/nvim-lspconfig.
Once neovim/nvim-lspconfig is installed, use lua require'lspconfig'.wgsl_analyzer.setup({}) in your init.vim.
You can also pass LSP settings to the server:
lua << EOF
local lspconfig = require'lspconfig'

local on_attach = function(client)
  require'completion'.on_attach(client)
end

lspconfig.wgsl_analyzer.setup({
  on_attach = on_attach,
  settings = {
    ["wgsl-analyzer"] = {

    }
  }
})
EOF
If you are running Neovim 0.10 or later, you can enable inlay hints via on_attach:
lspconfig.wgsl_analyzer.setup({
  on_attach = function(client, bufnr)
    vim.lsp.inlay_hint.enable(true, { bufnr = bufnr })
  end
})
Note that the hints are only visible after wgsl-analyzer has finished loading and you have to edit the file to trigger a re-render.
vim-lsp
vim-lsp is installed by following the plugin instructions.
It can be as simple as adding this line to your .vimrc:
Plug 'prabirshrestha/vim-lsp'
Next you need to register the wgsl-analyzer binary.
If it is available in $PATH, you may want to add this to your .vimrc:
if executable('wgsl-analyzer')
  au User lsp_setup call lsp#register_server({
    \   'name': 'wgsl-analyzer Language Server',
    \   'cmd': {server_info->['wgsl-analyzer']},
    \   'whitelist': ['wgsl', 'wesl'],
    \ })
endif
There is no dedicated UI for the server configuration, so you would need to send any options as a value of the initialization_options field, as described in the Configuration section.
Here is an example of how to enable the proc-macro support:
if executable('wgsl-analyzer')
  au User lsp_setup call lsp#register_server({
    \   'name': 'wgsl-analyzer Language Server',
    \   'cmd': {server_info->['wgsl-analyzer']},
    \   'whitelist': ['wgsl', 'wesl'],
    \   'initialization_options': {
    \     'cargo': {
    \       'buildScripts': {
    \         'enable': v:true,
    \       },
    \     },
    \     'procMacro': {
    \       'enable': v:true,
    \     },
    \   },
    \ })
endif
Sublime Text
Sublime Text 4
Follow the instructions in LSP-rust-analyzer, but substitute rust with wgsl where applicable.
Install LSP-file-watcher-chokidar to enable file watching (workspace/didChangeWatchedFiles).
Sublime Text 3
- Install the LSP package.
- From the command palette, run
LSP: Enable Language Server Globallyand selectwgsl-analyzer.
If it worked, you should see "wgsl-analyzer, Line X, Column Y" on the left side of the status bar, and after waiting a bit, functionalities like tooltips on hovering over variables should become available.
If you get an error saying No such file or directory: 'wgsl-analyzer', see the wgsl-analyzer binary installation section.
GNOME Builder
No support.
Eclipse IDE
No support.
Kate Text Editor
Support for the language server protocol is built into Kate through the LSP plugin, which is included by default.
To change wgsl-analyzer config options, start from the following example and put it into Kate's "User Server Settings" tab (located under the LSP Client settings):
{
  "servers": {
    "wgsl": {
      "command": ["wgsl-analyzer"],
      "url": "https://github.com/wgsl-analyzer/wgsl-analyzer",
      "highlightingModeRegex": "^WGSL$"
    },
    "wesl": {
      "command": ["wgsl-analyzer"],
      "url": "https://github.com/wgsl-analyzer/wgsl-analyzer",
      "highlightingModeRegex": "^WESL$"
    }
  }
}
Then click on apply, and restart the LSP server for your WGSL code or WESL project.
juCi++
juCi++ has built-in support for the language server protocol.
Kakoune
Kakoune supports LSP with the help of kak-lsp.
Follow the instructions to install kak-lsp.
To configure kak-lsp, refer to the configuration section.
It is about copying the configuration file to the right place.
The latest versions should use wgsl-analyzer by default.
Finally, you need to configure Kakoune to talk to kak-lsp (see Usage section).
A basic configuration will only get you LSP but you can also activate inlay diagnostics and auto-formatting on save.
The following might help you understand all of this:
eval %sh{kak-lsp --kakoune -s $kak_session}  # Not needed if you load it with plug.kak.
hook global WinSetOption filetype=(wgsl|wesl) %{
  # Enable LSP
  lsp-enable-window

  # Auto-formatting on save
  hook window BufWritePre .* lsp-formatting-sync

  # Configure inlay hints (only on save)
  hook window -group wgsl-inlay-hints BufWritePost .* wgsl-analyzer-inlay-hints
  hook -once -always window WinSetOption filetype=.* %{
    remove-hooks window wgsl-inlay-hints
  }
}
Helix
Helix supports LSP by default.
However, it will not install wgsl-analyzer automatically.
You can follow instructions for installing the wgsl-analyzer binary.
Visual Studio 2022
No support.
Lapce
No support.
Zed
No support.
IntelliJ IDEs
This includes:
- IntelliJ IDEA Ultimate
- WebStorm
- PhpStorm
- PyCharm Professional
- DataSpell
- RubyMine
- CLion
- Aqua
- DataGrip
- GoLand
- Rider
- RustRover
No support.
See #207
Troubleshooting
Start with looking at the wgsl-analyzer version.
Try the wgsl-analyzer: Show WA Version command in the Command Palette.
(Open the command pallete with Ctrl+Shift+P)
You can also run wgsl-analyzer --version in the command line.
If the date is more than a week ago, it is better to update your installation of wgsl-analyzer to the newest version.
The next thing to check would be panic messages in wgsl-analyzer's log.
Log messages are printed to stderr, in VS Code you can see them in the Output > wgsl-analyzer Language Server tab of the panel.
To see more logs, set the WA_LOG=info environment variable, this can be done either by setting the environment variable manually or by using wgsl-analyzer.server.extraEnv.
Note that both of these approaches require the server to be restarted.
To fully capture LSP messages between the editor and the server, run the wgsl-analyzer: Toggle LSP Logs command and check Output > wgsl-analyzer Language Server Trace.
The root cause for many "nothing works" problems is that wgsl-analyzer fails to understand the project structure.
To debug that, first note the wgsl-analyzer section in the status bar.
If it has an error icon and red, that is the problem (hover will have somewhat helpful error message).
wgsl-analyzer: Status prints dependency information for the current file.
Finally, WA_LOG=project_model=debug enables verbose logs during project loading.
If wgsl-analyzer outright crashes, try running wgsl-analyzer analysis-stats /path/to/project/directory/ on the command line.
This command type checks the whole project in batch mode bypassing LSP machinery.
When filing issues, it is useful (but not necessary) to try to minimize examples.
An ideal bug reproduction looks like this:
$ git clone https://github.com/username/repo.git && cd repo && git switch --detach commit-hash
$ wgsl-analyzer --version
wgsl-analyzer dd12184e4 2021-05-08 dev
$ wgsl-analyzer analysis-stats .
💀 💀 💀
It is especially useful when the repo does not use external crates or the standard library.
If you want to go as far as to modify the source code to debug the problem, be sure to take a look at the dev docs!
Configuration
Source: config.rs
The Installation section contains details on configuration for some of the editors.
In general, wgsl-analyzer is configured via LSP messages, which means that it is up to the editor to decide on the exact format and location of configuration files.
Some editors, such as VS Code or COC plugin in Vim, provide wgsl-analyzer-specific configuration UIs.
Other editors may require you to know a bit more about the interaction with wgsl-analyzer.
For the latter category, it might help to know that the initial configuration is specified as a value of the initializationOptions field of the InitializeParameters message, in the LSP protocol.
The spec says that the field type is any?, but wgsl-analyzer is looking for a JSON object that is constructed using settings from the list below.
The name of the setting, ignoring the wgsl-analyzer. prefix, is used as a path, and the value of the setting becomes the JSON property value.
Please consult your editor's documentation to learn more about how to configure LSP servers.
To verify which configuration is actually used by wgsl-analyzer, set the WA_LOG environment variable to wgsl_analyzer=info and look for config-related messages.
Logs should show both the JSON that wgsl-analyzer sees as well as the updated config.
This is the list of config options wgsl-analyzer supports:
Security
At the moment, wgsl-analyzer assumes that all code is trusted.
Here is a non-exhaustive list of ways to make wgsl-analyzer execute arbitrary code:
-
VS Code plugin reads configuration from project directory, and that can be used to override paths to various executables, like
wgslfmtorwgsl-analyzeritself. -
wgsl-analyzer's syntax trees library uses a lot ofunsafeand has not been properly audited for memory safety.
Privacy
The LSP server and the Code extension may access the network if the user configures it to import shaders from the internet.
Any other editor plugins are not under the control of the wgsl-analyzer developers.
For any privacy concerns, you should check with their respective developers.
For wgsl-analyzer developers, cargo xtask release uses the GitHub API to put together the release notes.
Features
Assists
Assists, or code actions, are small local refactorings available in a particular context.
They are usually triggered by a shortcut or by clicking a light bulb icon in the editor.
Cursor position or selection is signified by the ┃ character.
Diagnostics
Most errors and warnings provided by wgsl-analyzer come from wgsl-analyzer's own analysis.
Some of these diagnostics do not respect // wgsl-analyzer diagnostic control comments yet.
They can be turned off using the wgsl-analyzer.diagnostics.enable, wgsl-analyzer.diagnostics.experimental.enable, or wgsl-analyzer.diagnostics.disabled settings.
Editor Features
VS Code
Color configurations
It is possible to change the foreground/background color and font family/size of inlay hints.
Just add this to your settings.json:
{
  "editor.inlayHints.fontFamily": "Courier New",
  "editor.inlayHints.fontSize": 11,

  "workbench.colorCustomizations": {
    // Name of the theme you are currently using
    "[Default Dark+]": {
      "editorInlayHint.foreground": "#868686f0",
      "editorInlayHint.background": "#3d3d3d48",

      // Overrides for specific kinds of inlay hints
      "editorInlayHint.typeForeground": "#fdb6fdf0",
      "editorInlayHint.parameterForeground": "#fdb6fdf0",
    }
  }
}
Semantic style customizations
You can customize the look of different semantic elements in the source code.
For example, mutable bindings are underlined by default, and you can override this behavior by adding the following section to your settings.json:
{
  "editor.semanticTokenColorCustomizations": {
    "rules": {
      "*.mutable": {
        "fontStyle": "" // underline is the default
      }
    }
  }
}
Most themes do not support styling unsafe operations differently yet.
You can fix this by adding overrides for the rules operator.unsafe, function.unsafe, and method.unsafe:
{
  "editor.semanticTokenColorCustomizations": {
    "rules": {
      "operator.unsafe": "#ff6600",
      "function.unsafe": "#ff6600",
      "method.unsafe": "#ff6600"
    }
  }
}
In addition to the top-level rules, you can specify overrides for specific themes. For example, if you wanted to use a darker text color on a specific light theme, you might write:
{
  "editor.semanticTokenColorCustomizations": {
    "rules": {
      "operator.unsafe": "#ff6600"
    },
    "[Ayu Light]": {
      "rules": {
        "operator.unsafe": "#572300"
      }
    }
  }
}
Make sure you include the brackets around the theme name.
For example, use "[Ayu Light]" to customize the theme Ayu Light.
Special when clause context for keybindings
You may use the inWeslProject context to configure keybindings for WGSL/WESL projects only.
For example:
{
  "key": "ctrl+alt+d",
  "command": "wgsl-analyzer.openDocs",
  "when": "inWeslProject"
}
More about when clause contexts.
Setting runnable environment variables
You can use the wgsl-analyzer.runnables.extraEnv setting to define runnable environment-specific substitution variables.
The simplest way for all runnables in a bunch:
"wgsl-analyzer.runnables.extraEnv": {
  "RUN_SLOW_TESTS": "1"
}
Or it is possible to specify vars more granularly:
"wgsl-analyzer.runnables.extraEnv": [
  {
    // "mask": null, // null mask means that this rule will be applied for all runnables
    "env": {
      "APP_ID": "1",
      "APP_DATA": "asdf"
    }
  },
  {
    "mask": "test_name",
    "env": {
      "APP_ID": "2" // overwrites only APP_ID
    }
  }
]
You can use any valid regular expression as a mask.
Also, note that a full runnable name is something like run bin_or_example_name, test some::mod::test_name, or test-mod some::mod.
It is possible to distinguish binaries, single tests, and test modules with these masks: "^run", "^test " (the trailing space matters!), and "^test-mod" respectively.
If needed, you can set different values for different platforms:
"wgsl-analyzer.runnables.extraEnv": [
  {
    "platform": "win32", // windows only
    "env": {
      "APP_DATA": "windows specific data"
    }
  },
  {
    "platform": ["linux"],
    "env": {
      "APP_DATA": "linux data"
    }
  },
  { // for all platforms
    "env": {
      "APP_COMMON_DATA": "xxx"
    }
  }
]
Compiler feedback from external commands
You can configure VS Code to run a command in the background and use the $wgsl-analyzer-watch problem matcher to generate inline error markers from its output.
To do this, you need to create a new VS Code Task and set "wgsl-analyzer.checkOnSave": false in preferences.
Example .vscode/tasks.json:
{
  "label": "Watch",
  "group": "build",
  "type": "shell",
  "command": "example-tool watch",
  "problemMatcher": "$wgsl-analyzer-watch",
  "isBackground": true
}
Live Share
VS Code Live Share has partial support for wgsl-analyzer.
Live Share requires the official Microsoft build of VS Code; OSS builds will not work correctly.
The host's wgsl-analyzer instance will be shared with all guests joining the session.
The guests do not have to have the wgsl-analyzer extension installed for this to work.
If you are joining a Live Share session and do have wgsl-analyzer installed locally, then commands from the command palette will not work correctly.
This is because they will attempt to communicate with the local server, not the server of the session host.
Contributing Quick Start
wgsl-analyzer is an ordinary Rust project, which is organized as a Cargo workspace, builds on stable, and does not depend on C libraries.
Simply run the following to get started:
cargo test
To learn more about how wgsl-analyzer works, see Architecture.
It also explains the high-level layout of the source code.
Do skim through that document.
We also publish rustdoc docs to pages: https://wgsl-analyzer.github.io/wgsl-analyzer/ide. Note that the internal documentation is very incomplete.
Various organizational and process issues are discussed in this document.
Getting in Touch
Discussion happens in this Discord server:
Issue Labels
https://github.com/wgsl-analyzer/wgsl-analyzer/labels
- [A-Analyzer]: Affects the wgsl-analyzer crate
- [A-Base-DB]: Affects the base_db crate
- [A-Build-System]: CI stuff
- [A-Completion]: Affects the ide_completion crate
- [A-Cross-Cutting]: Affects many crates
- [A-Formatter]: Affects the wgsl-formatter crate
- [A-HIR]: Affects the hir or hir_def crate
- [A-IDE]: Affects the ide crate
- [A-Meta]: Affects non-code files such as documentation
- [A-wgslfmt]: Affects the wgslfmt crate
- [C-Bug]: Something isn't working
- [C-Dependencies]: Bump and migrate a dependency
- [C-Documentation]: Improvements or additions to documentation
- [C-Enhancement]: Improvement over an existing feature
- [C-Feature]: New feature or request
- [D-Complex]: Large implications, lots of changes, much thought
- [D-Modest]: "Normal" difficulty of solving
- [D-Straightforward]: Relatively easy to solve
- [D-Trivial]: Good for newcomers
- [S-Adopt-Me]: Extra attention is needed
- [S-Blocked]: Blocked on something else happening
- [S-Duplicate]: This issue or pull request already exists
- [S-Needs-Design]: The way this should be done is not yet clear
- [S-Needs-Investigation]: The cause of the issue is TBD
- [S-Needs-Triage]: Hasn't been triaged yet
- [S-Ready-to-Implement]: This issue is actionable and a solution can be proposed
- [S-Ready-to-Review]: This change is in a good state and needs someone (anyone!) to review it
- [S-Waiting-on-Author]: A change or a response from the author is needed
- [S-Won't-Fix]: This will not be worked on
Code Style & Review Process
See the Style Guide.
Cookbook
CI
We use GitHub Actions for CI.
Most of the things, including formatting, are checked by cargo test.
If cargo test passes locally, that is a good sign that CI will be green as well.
The only exception is that some long-running tests are skipped locally by default.
Use env RUN_SLOW_TESTS=1 cargo test to run the full suite.
We use bors to enforce the not rocket science rule.
Launching wgsl-analyzer
Debugging the language server can be tricky. LSP is rather chatty, so driving it from the command line is not really feasible, driving it via VS Code requires interacting with two processes.
For this reason, the best way to see how wgsl-analyzer works is to find a relevant test and execute it.
Launching a VS Code instance with a locally built language server is also possible. There is "Run Extension (Debug Build)" launch configuration for this in VS Code.
In general, I use one of the following workflows for fixing bugs and implementing features:
If the problem concerns only internal parts of wgsl-analyzer (i.e. I do not need to touch the wgsl-analyzer crate or TypeScript code), there is a unit-test for it.
So, I use wgsl-analyzer: Run action in VS Code to run this single test, and then just do printf-driven development/debugging.
As a sanity check after I am done, I use cargo xtask install --server and Reload Window action in VS Code to verify that the thing works as I expect.
If the problem concerns only the VS Code extension, I use Run Installed Extension launch configuration from launch.json.
Notably, this uses the usual wgsl-analyzer binary from PATH.
For this, it is important to have the following in your settings.json file:
{
    "wgsl-analyzer.server.path": "wgsl-analyzer"
}
After I am done with the fix, I use cargo xtask install --client to try the new extension for real.
If I need to fix something in the wgsl-analyzer crate, I feel sad because it is on the boundary between the two processes, and working there is slow.
I usually just cargo xtask install --server and poke changes from my live environment.
Note that this uses --release, which is usually faster overall, because loading stdlib into debug version of wgsl-analyzer takes a lot of time.
Note that you should only use the eprint! family of macros for debugging: stdout is used for LSP communication, and print! would break it.
If I need to fix something simultaneously in the server and in the client, I feel even more sad. I do not have a specific workflow for this case.
TypeScript Tests
If you change files under editors/code and would like to run the tests and linter, install npm and run:
cd editors/code
npm ci
npm run ci
Run npm run to see all available scripts.
How to
- ... add an assist? #7535
- ... add a new protocol extension? #4569
- ... add a new configuration option? #7451
- ... add a new completion? #6964
- ... allow new syntax in the parser? #7338
Logging
Logging is done by both wgsl-analyzer and VS Code, so it might be tricky to figure out where logs go.
Inside wgsl-analyzer, we use the tracing crate for logging, and tracing-subscriber for logging frontend.
By default, log goes to stderr, but the stderr itself is processed by VS Code.
--log-file <PATH> CLI argument allows logging to file.
Setting the WA_LOG_FILE=<PATH> environment variable will also log to file, it will also override --log-file.
To see stderr in the running VS Code instance, go to the "Output" tab of the panel and select wgsl-analyzer.
This shows eprintln! as well.
Note that stdout is used for the actual protocol, so println! will break things.
To log all communication between the server and the client, there are two choices:
-
You can log on the server side, by running something like
env WA_LOG=lsp_server=debug code . -
You can log on the client side, by the
wgsl-analyzer: Toggle LSP Logscommand or enabling"wgsl-analyzer.trace.server": "verbose"workspace setting. These logs are shown in a separate tab in the output and could be used with LSP inspector. Kudos to @DJMcNab for setting this awesome infra up!
There are also several VS Code commands which might be of interest:
-
wgsl-analyzer: Statusshows some memory-usage statistics. -
wgsl-analyzer: View Hirshows the HIR expressions within the function containing the cursor. -
If
wgsl-analyzer.showSyntaxTreeis enabled in settings,WGSL/WESL Syntax Tree: Focus on WGSL/WESL Syntax Tree Viewshows the syntax tree of the current file.You can click on nodes in the WGSL/WESL editor to go to the corresponding syntax node.
You can click on
Reveal Syntax Elementnext to a syntax node to go to the corresponding code and highlight the proper text range.If you trigger Go to Definition in the inspected source file, the syntax tree view should scroll to and select the appropriate syntax node token.
You can click on
Copynext to a syntax node to copy a text representation of the node.
Profiling
We have a built-in hierarchical profiler, you can enable it by using WA_PROFILE env-var:
WA_PROFILE=*             // dump everything
WA_PROFILE=foo|bar|baz   // enabled only selected entries
WA_PROFILE=*@3>10        // dump everything, up to depth 3, if it takes more than 10 ms
Some wgsl-analyzer contributors have export WA_PROFILE='*>10' in their shell profile.
For machine-readable JSON output, we have the WA_PROFILE_JSON env variable.
We support filtering only by span name:
WA_PROFILE=* // dump everything
WA_PROFILE_JSON="vfs_load|parallel_prime_caches|discover_command" // dump selected spans
We also have a "counting" profiler which counts number of instances of popular structs.
It is enabled by WA_COUNT=1.
Release Process
Release process is handled by release, dist, publish-release-notes and promote xtasks, release being the main one.
release assumes that you have checkouts of wgsl-analyzer and wgsl-analyzer.github.io in the same directory:
./wgsl-analyzer
./wgsl-analyzer.github.io
The remote for wgsl-analyzer must be called upstream (I use origin to point to my fork).
release calls the GitHub API calls to scrape pull request comments and categorize them in the changelog.
This step uses the curl and jq applications, which need to be available in PATH.
Finally, you need to obtain a GitHub personal access token and set the GITHUB_TOKEN environment variable.
Release steps:
- Set the
GITHUB_TOKENenvironment variable. - Inside wgsl-analyzer, run
cargo xtask release. This will:- checkout the
releasebranch - reset it to
upstream/nightly - push it to
upstream. This triggers GitHub Actions which:- runs
cargo xtask distto package binaries and VS Code extension - makes a GitHub release
- publishes the VS Code extension to the marketplace
- call the GitHub API for PR details
- create a new changelog in
wgsl-analyzer.github.io
- runs
- checkout the
- While the release is in progress, fill in the changelog.
- Commit & push the changelog.
- Run
cargo xtask publish-release-notes <CHANGELOG>-- this will convert the changelog entry in AsciiDoc to Markdown and update the body of GitHub Releases entry.
If the GitHub Actions release fails because of a transient problem like a timeout, you can re-run the job from the Actions console.
If it fails because of something that needs to be fixed, remove the release tag (if needed), fix the problem, then start over.
Make sure to remove the new changelog post created when running cargo xtask release a second time.
We release "nightly" every night automatically and promote the latest nightly to "stable" manually, every week.
We do not do "patch" releases, unless something truly egregious comes up.
To do a patch release, cherry-pick the fix on top of the current release branch and push the branch.
There is no need to write a changelog for a patch release, it is OK to include the notes about the fix into the next weekly one.
Note: we tag releases by dates, releasing a patch release on the same day should work (by overwriting a tag), but I am not 100% sure.
Permissions
Triage Team
We have a dedicated triage team that helps manage issues and pull requests on GitHub. Members of the triage team have permissions to:
- Label issues and pull requests
- Close and reopen issues
- Assign issues and PRs to milestones
This team plays a crucial role in ensuring that the project remains organized and that contributions are properly reviewed and addressed.
Architecture
This document describes the high-level architecture of wgsl-analyzer. If you want to familiarize yourself with the code base, you are just in the right place!
Since wgsl-analyzer is largely copied from rust-analyzer, you might also enjoy the Explaining Rust Analyzer series on YouTube.
It goes deeper than what is covered in this document, but will take some time to watch.
See also these implementation-related blog posts:
- https://rust-analyzer.github.io/blog/2019/11/13/find-usages.html
- https://rust-analyzer.github.io/blog/2020/07/20/three-architectures-for-responsive-ide.html
- https://rust-analyzer.github.io/blog/2020/09/16/challeging-LR-parsing.html
- https://rust-analyzer.github.io/blog/2020/09/28/how-to-make-a-light-bulb.html
- https://rust-analyzer.github.io/blog/2020/10/24/introducing-ungrammar.html
For older, by now mostly outdated stuff, see the guide and another playlist.
Bird's Eye View
- Entry Points
- Code Map
xtaskeditors/codelibcrates/parsercrates/syntaxcrates/base-dbcrates/hir-def,crates/hir_tycrates/hircrates/ide,crates/ide-db,crates/ide-assists,crates/ide-completion,crates/ide-diagnostics,crates/ide-ssrcrates/wgsl-analyzercrates/toolchain,crates/project-model,crates/flycheckcrates/cfgcrates/vfs,crates/vfs-notify,crates/pathscrates/stdxcrates/profilecrates/span
- Cross-Cutting Concerns
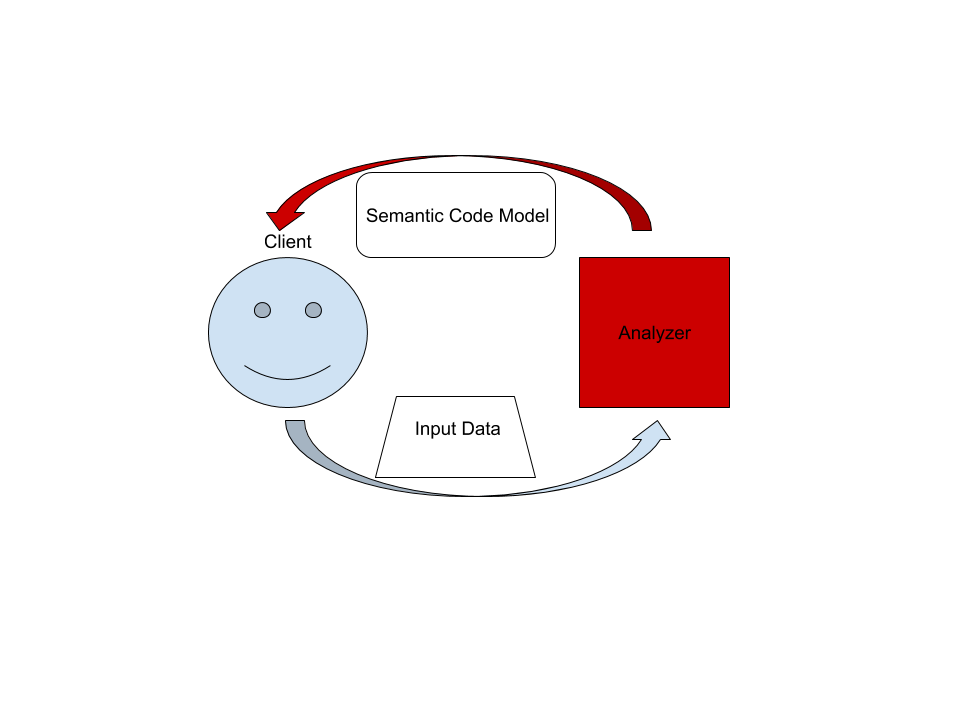
On the highest level, wgsl-analyzer is a thing which accepts input source code from the client and produces a structured semantic model of the code.
More specifically, input data consists of a set of test files ((PathBuf, String) pairs) and information about project structure, captured in the so-called CrateGraph.
The crate graph specifies which files are crate roots, which cfg flags are specified for each crate, and what dependencies exist between the crates.
This is the input (ground) state.
The analyzer keeps all this input data in memory and never does any IO.
Because the input data is source code, which typically measures in tens of megabytes at most, keeping everything in memory is OK.
A "structured semantic model" is basically an object-oriented representation of modules, functions, and types which appear in the source code. This representation is fully "resolved": all expressions have types, all references are bound to declarations, etc. This is derived state.
The client can submit a small delta of input data (typically, a change to a single file) and get a fresh code model which accounts for changes.
The underlying engine makes sure that the model is computed lazily (on-demand) and can be quickly updated for small modifications.
Entry Points
crates/wgsl-analyzer/src/bin/main.rs contains the main function which spawns LSP.
This is the entry point, but it front-loads a lot of complexity, so it is fine to just skim through it.
crates/wgsl-analyzer/src/handlers/request.rs implements all LSP requests and is a great place to start if you are already familiar with LSP.
Analysis and AnalysisHost types define the main API for consumers of IDE services.
Code Map
This section talks briefly about various important directories and data structures. Pay attention to the Architecture Invariant sections. They often talk about things which are deliberately absent in the source code.
Note also which crates are API Boundaries. Remember, rules at the boundary are different.
xtask
This is wgsl-analyzer's "build system".
We use cargo to compile Rust code, but there are also various other tasks, such as release management or local installation.
Those are handled by Rust code in the xtask directory.
editors/code
The VS Code extension.
lib
wgsl-analyzer-independent libraries which we publish to crates.io.
It is not heavily utilized at the moment.
crates/parser
Architecture Invariant: the parser is independent of the particular tree structure and particular representation of the tokens.
It transforms one flat stream of events into another flat stream of events.
Token independence allows us to parse out both text-based source code and tt-based macro input.
Tree independence allows us to more easily vary the syntax tree implementation.
It should also unlock efficient light-parsing approaches.
For example, you can extract the set of names defined in a file (for typo correction) without building a syntax tree.
Architecture Invariant: parsing never fails, the parser produces (T, Vec<Error>) rather than Result<T, Error>.
crates/syntax
WESL syntax tree structure and parser.
See RFC and ./syntax.md for some design notes.
rowanlibrary is used for constructing syntax trees.astprovides a type safe API on top of the rawrowantree.ungrammardescription of the grammar, which is used to generatesyntax_kindsandastmodules, usingcargo test -p xtaskcommand.
Tests for wa_syntax are mostly data-driven.
test_data/parser contains subdirectories with a bunch of .rs (test vectors) and .txt files with corresponding syntax trees.
During testing, we check .rs against .txt.
If the .txt file is missing, it is created (this is how you update tests).
Additionally, running the xtask test suite with cargo test -p xtask will walk the grammar module and collect all // test test_name comments into files inside test_data/parser/inline directory.
To update test data, run with UPDATE_EXPECT variable:
env UPDATE_EXPECT=1 cargo qt
After adding a new inline test you need to run cargo test -p xtask and also update the test data as described above.
Note api_walkthrough
in particular: it shows off various methods of working with syntax tree.
See #TODO for an example PR which fixes a bug in the grammar.
Architecture Invariant: syntax crate is completely independent from the rest of wgsl-analyzer.
It knows nothing about salsa or LSP.
This is important because it is possible to make useful tooling using only the syntax tree.
Without semantic information, you do not need to be able to build code, which makes the tooling more robust.
See also https://mlfbrown.com/paper.pdf.
You can view the syntax crate as an entry point to wgsl-analyzer.
syntax crate is an API Boundary.
Architecture Invariant: syntax tree is a value type. The tree is fully determined by the contents of its syntax nodes, it does not need global context (like an interner) and does not store semantic info. Using the tree as a store for semantic info is convenient in traditional compilers, but does not work nicely in the IDE. Specifically, assists, and refactors require transforming syntax trees, and that becomes awkward if you need to do something with the semantic info.
Architecture Invariant: syntax tree is built for a single file. This is to enable parallel parsing of all files.
Architecture Invariant: Syntax trees are by design incomplete and do not enforce well-formedness.
If an AST method returns an Option, it can be None at runtime, even if this is forbidden by the grammar.
crates/base-db
We use the salsa crate for incremental and on-demand computation.
Roughly, you can think of salsa as a key-value store, but it can also compute derived values using specified functions.
The base-db crate provides basic infrastructure for interacting with salsa.
Crucially, it defines most of the "input" queries: facts supplied by the client of the analyzer.
Reading the docs of the base_db::input module should be useful: everything else is strictly derived from those inputs.
Architecture Invariant: particularities of the build system are not the part of the ground state.
In particular, base-db knows nothing about cargo.
For example, cfg flags are a part of base_db, but features are not.
A foo feature is a Cargo-level concept, which is lowered by Cargo to --cfg feature=foo argument on the command line.
The CrateGraph structure is used to represent the dependencies between the crates abstractly.
Architecture Invariant: base-db does not know about file system and file paths.
Files are represented with opaque FileId, there is no operation to get an std::path::Path out of the FileId.
crates/hir-def, crates/hir_ty
These crates are the brain of wgsl-analyzer. This is the compiler part of the IDE.
hir-xxx crates have a strong ECS flavor, in that they work with raw ids and directly query the database.
There is very little abstraction here.
These crates integrate deeply with salsa and chalk.
Name resolution and type inference all happen here. These crates also define various intermediate representations of the core.
ItemTree condenses a single SyntaxTree into a "summary" data structure, which is stable over modifications to function bodies.
DefMap contains the module tree of a crate and stores module scopes.
Body stores information about expressions.
Architecture Invariant: these crates are not, and will never be, an api boundary.
Architecture Invariant: these crates explicitly care about being incremental.
The core invariant we maintain is "typing inside a function's body never invalidates global derived data".
i.e., if you change the body of foo, all facts about bar should remain intact.
Architecture Invariant: hir exists only in context of particular crate instance with specific CFG flags. The same syntax may produce several instances of HIR if the crate participates in the crate graph more than once.
crates/hir
The top-level hir crate is an API Boundary.
If you think about "using wgsl-analyzer as a library", hir crate is most likely the interface that you will be talking to.
It wraps ECS-style internal API into a more OO-flavored API (with an extra db argument for each call).
Architecture Invariant: hir provides a static, fully resolved view of the code.
While internal hir-* crates compute things, hir, from the outside, looks like an inert data structure.
hir also handles the delicate task of going from syntax to the corresponding hir.
Remember that the mapping here is one-to-many.
See Semantics type and source_to_def module.
Note in particular a curious recursive structure in source_to_def.
We first resolve the parent syntax node to the parent hir element.
Then we ask the hir parent what syntax children does it have.
Then we look for our node in the set of children.
This is the heart of many IDE features, like goto definition, which start with figuring out the hir node at the cursor. This is some kind of (yet unnamed) uber-IDE pattern, as it is present in Roslyn and Kotlin as well.
crates/ide, crates/ide-db, crates/ide-assists, crates/ide-completion, crates/ide-diagnostics, crates/ide-ssr
The ide crate builds on top of hir semantic model to provide high-level IDE features like completion or goto definition.
It is an API Boundary.
If you want to use IDE parts of wgsl-analyzer via LSP, custom flatbuffers-based protocol or just as a library in your text editor, this is the right API.
Architecture Invariant: ide crate's API is build out of POD types with public fields.
The API uses editor's terminology, it talks about offsets and string labels rather than in terms of definitions or types.
It is effectively the view in MVC and viewmodel in MVVM.
All arguments and return types are conceptually serializable.
In particular, syntax trees and hir types are generally absent from the API (but are used heavily in the implementation).
Shout outs to LSP developers for popularizing the idea that "UI" is a good place to draw a boundary at.
ide is also the first crate which has the notion of change over time.
AnalysisHost is a state to which you can transactionally apply_change.
Analysis is an immutable snapshot of the state.
Internally, ide is split across several crates.
ide-assists, ide-completion, ide-diagnostics and ide-ssr implement large isolated features.
ide-db implements common IDE functionality (notably, reference search is implemented here).
The ide contains a public API, as well as implementation for a plethora of smaller features.
Architecture Invariant: ide crate strives to provide a perfect API.
Although at the moment it has only one consumer, the LSP server, LSP does not influence its API design.
Instead, we keep in mind a hypothetical ideal client - an IDE tailored specifically for WGSL and WESL, every nook and cranny of which is packed with language-specific goodies.
crates/wgsl-analyzer
This crate defines the wgsl-analyzer binary, so it is the entry point.
It implements the language server.
Architecture Invariant: wgsl-analyzer is the only crate that knows about LSP and JSON serialization.
If you want to expose a data structure X from ide to LSP, do not make it serializable.
Instead, create a serializable counterpart in wgsl-analyzer crate and manually convert between the two.
GlobalState is the state of the server.
The main_loop defines the server event loop, which accepts requests and sends responses.
Requests that modify the state or might block a user's typing are handled on the main thread.
All other requests are processed in background.
Architecture Invariant: the server is stateless, a-la HTTP.
Sometimes state needs to be preserved between requests.
For example, "what is the edit for the fifth completion item of the last completion edit?".
For this, the second request should include enough info to re-create the context from scratch.
This generally means including all the parameters of the original request.
reload module contains the code that handles configuration and Cargo.toml changes.
This is a tricky business.
Architecture Invariant: wgsl-analyzer should be partially available even when the build is broken.
Reloading process should not prevent IDE features from working.
crates/toolchain, crates/project-model, crates/flycheck
These crates deal with invoking cargo to learn about project structure and get compiler errors for the "check on save" feature.
They use crates/paths heavily instead of std::path.
A single wgsl-analyzer process can serve many projects, so it is important that the server's current working directory does not leak.
crates/cfg
This crate is responsible for parsing, evaluation, and general definition of cfg attributes.
crates/vfs, crates/vfs-notify, crates/paths
These crates implement a virtual file system. They provide consistent snapshots of the underlying file system and insulate messy OS paths.
Architecture Invariant: vfs does not assume a single unified file system.
i.e., a single wgsl-analyzer process can act as a remote server for two different machines, where the same /tmp/foo.rs path points to different files.
For this reason, all path APIs generally take some existing path as a "file system witness".
crates/stdx
This crate contains various non-wgsl-analyzer specific utils, which could have been in std, as well
as copies of unstable std items we would like to make use of already, like std::str::split_once.
crates/profile
This crate contains utilities for CPU and memory profiling.
crates/span
This crate exposes types and functions related to wgsl-analyzer's span for macros.
A span is effectively a text range relative to some item in a file with a given SyntaxContext (hygiene).
Cross-Cutting Concerns
This sections talks about the things which are everywhere and nowhere in particular.
Stability Guarantees
One of the reasons wgsl-analyzer moves relatively fast is that we do not introduce new stability guarantees.
Instead, as much as possible we leverage existing ones.
Examples:
- The
ideAPI ofwgsl-analyzeris explicitly unstable, but the LSP interface is stable, and here we just implement a stable API managed by someone else. - WGSL spec is almost stable, and it is the primary input to
wgsl-analyzer.
Exceptions:
- We ship some LSP extensions, and we try to keep those somewhat stable. Here, we need to work with a finite set of editor maintainers, so not providing rock-solid guarantees works.
Code generation
Some components in this repository are generated through automatic processes.
Generated code is updated automatically on cargo test.
Generated code is generally committed to the git repository.
In particular, we generate:
-
Various sections of the manual:
- features
- assists
- config
-
Documentation tests for assists
See the xtask\src\codegen\assists_doc_tests.rs module for details.
Cancellation
Suppose that the IDE is in the process of computing syntax highlighting when the user types foo.
What should happen?
wgsl-analyzers answer is that the highlighting process should be cancelled - its results are now stale, and it also blocks modification of the inputs.
The salsa database maintains a global revision counter.
When applying a change, salsa bumps this counter and waits until all other threads using salsa finish.
If a thread does salsa-based computation and notices that the counter is incremented, it panics with a special value (see Canceled::throw).
That is, wgsl-analyzer requires unwinding.
ide is the boundary where the panic is caught and transformed into a Result<T, Cancelled>.
Testing
wgsl-analyzer has three interesting system boundaries to concentrate tests on.
The outermost boundary is the wgsl-analyzer crate, which defines an LSP interface in terms of stdio.
We do integration testing of this component, by feeding it with a stream of LSP requests and checking responses.
These tests are known as "heavy", because they interact with Cargo and read real files from disk.
For this reason, we try to avoid writing too many tests on this boundary: in a statically typed language, it is hard to make an error in the protocol itself if messages are themselves typed.
Heavy tests are only run when RUN_SLOW_TESTS env var is set.
The middle, and most important, boundary is ide.
Unlike wgsl-analyzer, which exposes API, ide uses WGSL API and is intended for use by various tools.
A typical test creates an AnalysisHost, calls some Analysis functions and compares the results against expectation.
The innermost and most elaborate boundary is hir.
It has a much richer vocabulary of types than ide, but the basic testing setup is the same: we create a database, run some queries, assert result.
For comparisons, we use the expect crate for snapshot testing.
To test various analysis corner cases and avoid forgetting about old tests, we use so-called marks. See the cov_mark crate documentation for more.
Architecture Invariant: wgsl-analyzer tests do not use libcore or libstd.
All required library code must be a part of the tests.
This ensures fast test execution.
Architecture Invariant: tests are data driven and do not test the API. Tests which directly call various API functions are a liability, because they make refactoring the API significantly more complicated. Most of the tests look like this:
#[track_caller]
fn check(input: &str, expect: expect_test::Expect) {
    // The single place that actually exercises a particular API
}

#[test]
fn foo() {
    check("foo", expect![["bar"]]);
}

#[test]
fn spam() {
    check("spam", expect![["eggs"]]);
}
// ...and a hundred more tests that do not care about the specific API at all.
To specify input data, we use a single string literal in a special format, which can describe a set of WGSL files.
See the Fixture its module for fixture examples and documentation.
Architecture Invariant: all code invariants are tested by #[test] tests.
There is no additional checks in CI, formatting, and tidy tests are run with cargo test.
Architecture Invariant: tests do not depend on any kind of external resources, they are perfectly reproducible.
Performance Testing
TBA, take a look at the metrics xtask and #[test] fn benchmark_xxx() functions.
Error Handling
Architecture Invariant: core parts of wgsl-analyzer (ide/hir) do not interact with the outside world and thus cannot fail.
Only parts touching LSP are allowed to do IO.
Internals of wgsl-analyzer need to deal with broken code, but this is not an error condition.
wgsl-analyzer is robust: various analysis compute (T, Vec<Error>) rather than Result<T, Error>.
wgsl-analyzer is a complex, long-running process.
It will always have bugs and panics;
to mitigate this, a panic in an isolated feature should not bring down the whole process.
Each LSP-request is protected by a catch_unwind.
We use always and never macros instead of assert to gracefully recover from impossible conditions.
Observability
wgsl-analyzer is a long-running process, so it is important to understand what happens inside.
We have several instruments for that.
The event loop that runs wgsl-analyzer is very explicit.
Rather than spawning futures or scheduling callbacks (open), the event loop accepts an enum of possible events (closed).
It is easy to see all the things that trigger wgsl-analyzer processing together with their performance.
wgsl-analyzer includes a simple hierarchical profiler (hprof).
It is enabled with WA_PROFILE='*>50' env var (log all (*) actions which take more than 50 ms) and produces output like:
85ms - handle_completion
    68ms - import_on_the_fly
        67ms - import_assets::search_for_relative_paths
             0ms - crate_def_map:wait (804 calls)
             0ms - find_path (16 calls)
             2ms - find_similar_imports (1 calls)
             0ms - generic_params_query (334 calls)
            59ms - trait_solve_query (186 calls)
         0ms - Semantics::analyze_impl (1 calls)
         1ms - render_resolution (8 calls)
     0ms - Semantics::analyze_impl (5 calls)
This is cheap enough to enable in production.
Similarly, we save live object counting (WA_COUNT=1).
It is not cheap enough to enable in production, and this is a bug which should be fixed.
Configurability
wgsl-analyzer strives to be as configurable as possible while offering reasonable defaults where no configuration exists yet.
The rule of thumb is to enable most features by default unless they are buggy or degrade performance too much.
There will always be features that some people find more annoying than helpful, so giving the users the ability to tweak or disable these is a big part of offering a good user experience.
Enabling them by default is a matter of discoverability, as many users do not know about some features even though they are presented in the manual.
Mind the code-architecture gap: at the moment, we are using fewer feature flags than we really should.
Debugging VS Code plugin and the language server
Prerequisites
- Install LLDB and the LLDB Extension.
- Open the root folder in VS Code. Here you can access the preconfigured debug setups.

-
Install all TypeScript dependencies
cd editors/code
npm ci
Common knowledge
- All debug configurations open a new
[Extension Development Host]VS Code instance where only thewgsl-analyzerextension being debugged is enabled. - To activate the extension you need to open any WESL project's folder in
[Extension Development Host].
Debug TypeScript VS Code extension
Run Installed Extension- runs the extension with the globally installedwgsl-analyzerbinary.Run Extension (Debug Build)- runs extension with the locally built LSP server (target/debug/wgsl-analyzer).
TypeScript debugging is configured to watch your source edits and recompile.
To apply changes to an already running debug process, press Ctrl+Shift+P
and run the following command in your [Extension Development Host]
> Developer: Reload Window
Debugging the LSP server
-
When attaching a debugger to an already running
wgsl-analyzerserver on Linux, you might need to enableptracefor unrelated processes by running:echo 0 | sudo tee /proc/sys/kernel/yama/ptrace_scope -
By default, the LSP server is built without debug information. To enable it, you will need to change
Cargo.toml:[profile.dev] debug = 2
- Select
Run Extension (Debug Build)to run your locally builttarget/debug/wgsl-analyzer. - In the original VS Code window once again select the
Attach To Serverdebug configuration. - A list of running processes should appear. Select the
wgsl-analyzerfrom this repo. - Navigate to
crates/wgsl-analyzer/src/main_loop.rsand add a breakpoint to theon_requestfunction. - Go back to the
[Extension Development Host]instance and hover over a Rust variable and your breakpoint should hit.
If you need to debug the server from the very beginning, including its initialization
code, you can use the --wait-dbg command line argument or WA_WAIT_DBG environment variable.
The server will spin at the beginning of the try_main function (see crates\wgsl-analyzer\src\bin\main.rs)
let mut d = 4;
while d == 4 { // set a breakpoint here and change the value
	d = 4;
}
However for this to work, you will need to enable debug_assertions in your build
RUSTFLAGS='--cfg debug_assertions' cargo build --release
Demo
- Debugging TypeScript VScode extension.
- Debugging the LSP server (rust-analyzer, same advice applies).
Troubleshooting
Cannot find the wgsl-analyzer process
It could be a case of just jumping the gun.
Make sure you open a WGSL or WESL file in the [Extension Development Host] and try again.
Cannot connect to wgsl-analyzer
Make sure you have run echo 0 | sudo tee /proc/sys/kernel/yama/ptrace_scope.
By default this should reset back to 1 every time you log in.
Breakpoints are never being hit
Check your version of lldb.
If it is version 6 and lower, use the classic adapter type.
It is lldb.adapterType in settings file.
If you are running lldb version 7, change the lldb adapter type to bundled or native.
Guide to wgsl-analyzer
About the guide
This guide describes the current state of wgsl-analyzer as of the 2025-xx-xx release (git tag 2025-xx-xx).
Its purpose is to document various problems and architectural solutions related to the problem of building an IDE-first compiler for Rust.
- The big picture
- IDE API
- Inputs
- Source roots (a.k.a. "Filesystems are horrible")
- Language Server Protocol
- Salsa
- Salsa Input Queries
- From text to semantic model
- Syntax trees
- Building a Module Tree
- Location Interner pattern
- Macros and recursive locations
- Name resolution
- Source Map pattern
- Type inference
- Tying it all together: completion
The big picture
On the highest possible level, rust-analyzer is a stateful component.
A client may apply changes to the analyzer (new contents of foo.rs file is "fn main() {}") and it may ask semantic questions about the current state (what is the definition of the identifier with offset 92 in file bar.rs?).
Two important properties hold:
-
Analyzer does not do any I/O. It starts in an empty state and all input data is provided via
apply_changeAPI. -
Only queries about the current state are supported. One can, of course, simulate undo and redo by keeping a log of changes and inverse changes respectively.
IDE API
To see the bigger picture of how the IDE features work, examine the AnalysisHost and Analysis pair of types.
AnalysisHost has three methods:
default()for creating an empty analysis instanceapply_change(&mut self)to make changes (this is how you get from an empty state to something interesting)analysis(&self)to get an instance ofAnalysis
Analysis has a ton of methods for IDEs, like goto_definition, or completions.
Both inputs and outputs of Analysis' methods are formulated in terms of files and offsets, and not in terms of Rust concepts like structs, traits, etc.
The "typed" API with Rust-specific types is slightly lower in the stack, we will talk about it later.
The reason for this separation of Analysis and AnalysisHost is that we want to apply changes "uniquely", but we might also want to fork an Analysis and send it to another thread for background processing.
That is, there is only a single AnalysisHost, but there may be several (equivalent) Analysis.
Note that all of the Analysis API return Cancellable<T>.
This is required to be responsive in an IDE setting.
Sometimes a long-running query is being computed and the user types something in the editor and asks for completion.
In this case, we cancel the long-running computation (so it returns Err(Cancelled)), apply the change and execute the request for completion.
We never use stale data to answer requests.
Under the cover, AnalysisHost "remembers" all outstanding Analysis instances.
The AnalysisHost::apply_change method cancels all Analysises, blocks until all of them are Dropped and then applies changes in-place.
This may be familiar to Rustaceans who use read-write locks for interior mutability.
Next, the inputs to the Analysis are discussed in detail.
Inputs
rust-analyzer never does any I/O itself.
All inputs get passed explicitly via the AnalysisHost::apply_change method, which accepts a single argument, a Change.
Change is a wrapper for FileChange that adds proc-macro knowledge.
FileChange is a builder for a single change "transaction," so it suffices to study its methods to understand all the input data.
The change_file method controls the set of the input files, where each file has an integer id (FileId, picked by the client) and text (Option<Arc<str>>).
Paths are tricky; they will be explained below, in the source roots section, together with the set_roots method.
The "source root" is_library flag along with the concept of durability allows us to add a group of files that are assumed to rarely change.
It is mostly an optimization and does not change the fundamental picture.
The set_crate_graph method allows us to control how the input files are partitioned into compilation units -- crates.
It also controls (in theory, not implemented yet) cfg flags.
CrateGraph is a directed acyclic graph of crates.
Each crate has a root FileId, a set of active cfg flags, and a set of dependencies.
Each dependency is a pair of a crate and a name.
It is possible to have two crates with the same root FileId but different cfg-flags/dependencies.
This model is lower than Cargo's model of packages: each Cargo package consists of several targets, each of which is a separate crate (or several crates, if you try different feature combinations).
Procedural macros are inputs as well, roughly modeled as a crate with a bunch of additional black box dyn Fn(TokenStream) -> TokenStream functions.
Next, the process of building an LSP server on top of Analysis is discussed.
However, before that, it is important to address the issue with paths.
Source roots (a.k.a. "Filesystems are horrible")
This is a non-essential section, feel free to skip.
The previous section said that the filesystem path is an attribute of a file, but this is not the whole truth.
Making it an absolute PathBuf will be bad for several reasons.
First, filesystems are full of (platform-dependent) edge cases:
- It is hard (requires a syscall) to decide if two paths are equivalent.
- Some filesystems are case-sensitive (e.g. macOS).
- Paths are not necessarily UTF-8.
- Symlinks can form cycles.
Second, this might hurt the reproducibility and hermeticity of builds.
In theory, moving a project from /foo/bar/my-project to /spam/eggs/my-project should not change a bit in the output.
However, if the absolute path is a part of the input, it is at least in theory observable, and could affect the output.
Yet another problem is that we really really want to avoid doing I/O, but with Rust the set of "input" files is not necessarily known up-front.
In theory, you can have #[path="/dev/random"] mod foo;.
To solve (or explicitly refuse to solve) these problems rust-analyzer uses the concept of a "source root".
Roughly speaking, source roots are the contents of a directory on a file system, like /home/matklad/projects/rustraytracer/**.rs.
More precisely, all files (FileIds) are partitioned into disjoint SourceRoots.
Each file has a relative UTF-8 path within the SourceRoot.
SourceRoot has an identity (integer ID).
Crucially, the root path of the source root itself is unknown to the analyzer: A client is supposed to maintain a mapping between SourceRoot IDs (which are assigned by the client) and actual PathBufs.
SourceRoots give a sane tree model of the file system to the analyzer.
Note that mod, #[path] and include!() can only reference files from the same source root.
It is of course possible to explicitly add extra files to the source root, even /dev/random.
Language Server Protocol
The Analysis API is exposed via the JSON RPC-based language server protocol.
The hard part here is managing changes (which can come either from the file system or from the editor) and concurrency (we want to spawn background jobs for things like syntax highlighting).
We use the event loop pattern to manage the zoo, and the loop is the GlobalState::run function initiated by main_loop after GlobalState::new does a one-time initialization and tearing down of the resources.
A typical analyzer session involves several steps.
First, we need to figure out what to analyze.
To do this, we run cargo metadata to learn about Cargo packages for the current workspace and dependencies, and we run rustc --print sysroot and scan the "sysroot" (the directory containing the current Rust toolchain's files) to learn about crates like std.
This happens in the GlobalState::fetch_workspaces method.
We load this configuration at the start of the server in GlobalState::new, but it is also triggered by workspace change events and requests to reload the workspace from the client.
The ProjectModel we get after this step is very Cargo and sysroot specific, it needs to be lowered to get the input in the form of Change.
This happens in the GlobalState::process_changes method.
Specifically:
- Create
SourceRoots for each Cargo package(s) and sysroot. - Schedule a filesystem scan of the roots.
- Create an analyzer's
Cratefor each Cargo target and sysroot crate. - Set up dependencies between the crates.
The results of the scan (which may take a while) will be processed in the body of the main loop, just like any other change. Here, the following are handled:
After a single loop's turn, we group the changes into one Change and apply it.
This always happens on the main thread and blocks the loop.
To handle requests, like "goto definition", we create an instance of the Analysis and schedule the task (which consumes Analysis) on the thread pool.
The task calls the corresponding Analysis method, while massaging the types into the LSP representation.
Keep in mind that if we are executing "goto definition" on the thread pool and a new change comes in, the task will be canceled as soon as the main loop calls apply_change on the AnalysisHost.
This concludes the overview of the analyzer's programming interface. Next, explore the implementation details.
Salsa
The most straightforward way to implement an "apply change, get analysis, repeat" API would be to maintain the input state and to compute all possible analysis information from scratch after every change. This works, but scales poorly with the size of the project. To make this fast, we need to take advantage of the fact that most of the changes are small, and that analysis results are unlikely to change significantly between invocations.
To do this we use salsa: a framework for incremental on-demand computation.
You can skip the rest of the section if you are familiar with rustc's red-green algorithm (which is used for incremental compilation).
It is better to refer to salsa's docs to learn about it. Here is a small excerpt:
The key idea of salsa is that you define your program as a set of queries.
Every query is used like a function K -> V that maps from some key of type K to a value of type V.
Queries come in two basic varieties:
-
Inputs: the base inputs to your system. You can change these whenever you like.
-
Functions: pure functions (no side effects) that transform your inputs into other values. The results of queries are memoized to avoid recomputing them a lot. When you make changes to the inputs, we will figure out (fairly intelligently) when we can reuse these memoized values and when we have to recompute them.
For further discussion, it's important to understand one bit of "fairly intelligently".
Suppose we have two functions, f1 and f2, and one input, z.
We call f1(X) which in turn calls f2(Y) which inspects i(Z).
i(Z) returns some value V1, f2 uses that and returns R1, f1 uses that and returns O.
Now, suppose i at Z is changed to V2 from V1.
Try to compute f1(X) again.
Because f1(X) (transitively) depends on i(Z), we cannot just reuse its value as is.
However, if f2(Y) is still equal to R1 (despite i's change), we, in fact, can reuse O as the result of f1(X).
And that is how salsa works: it recomputes results in reverse order, starting from inputs and progressing towards outputs, stopping as soon as it sees an intermediate value that has not changed.
If this sounds confusing to you, do not worry: it is confusing.
This illustration by @killercup might help:


Salsa Input Queries
All analyzer information is stored in a salsa database.
Analysis and AnalysisHost types are essentially newtype wrappers for RootDatabase -- a salsa database.
Salsa input queries are defined in SourceDatabase and SourceDatabaseExt (which are a part of RootDatabase).
They closely mirror the familiar Change structure: indeed, what apply_change does is it sets the values of input queries.
From text to semantic model
The bulk of the rust-analyzer is transforming input text into a semantic model of Rust code: a web of entities like modules, structs, functions, and traits.
An important fact to realize is that (unlike most other languages like C# or Java) there is not a one-to-one mapping between the source code and the semantic model.
A single function definition in the source code might result in several semantic functions: for example, the same source file might get included as a module in several crates or a single crate might be present in the compilation DAG several times, with different sets of cfgs enabled.
The IDE-specific task of mapping source code into a semantic model is inherently imprecise for this reason and gets handled by the source_analyzer.
The semantic interface is declared in the semantics module.
Each entity is identified by an integer ID and has a bunch of methods which take a salsa database as an argument and return other entities (which are also IDs).
Internally, these methods invoke various queries on the database to build the model on demand.
Here is the list of queries.
The first step of building the model is parsing the source code.
Syntax trees
An important property of the Rust language is that each file can be parsed in isolation.
Unlike, say, C++, an include cannot change the meaning of the syntax.
For this reason, rust-analyzer can build a syntax tree for each "source file", which could then be reused by several semantic models if this file happens to be a part of several crates.
The representation of syntax trees that rust-analyzer uses is similar to that of Roslyn and Swift's new libsyntax.
Swift's docs give an excellent overview of the approach, so I skip this part here and instead outline the main characteristics of the syntax trees:
-
Syntax trees are fully lossless. Converting any text to a syntax tree and back is a total identity function. All whitespace and comments are explicitly represented in the tree.
-
Syntax nodes have generic
(next|previous)_sibling,parent,(first|last)_childfunctions. You can get from any one node to any other node in the file using only these functions. -
Syntax nodes know their range (start offset and length) in the file.
-
Syntax nodes share the ownership of their syntax tree: if you keep a reference to a single function, the whole enclosing file is alive.
-
Syntax trees are immutable and the cost of replacing the subtree is proportional to the depth of the subtree. Read Swift's docs to learn how immutable + parent pointers + cheap modification is possible.
-
Syntax trees are built on a best-effort basis. All accessor methods return
Options. The tree forfn foowill contain a function declaration withNonefor parameter list and body. -
Syntax trees do not know the file they are built from, they only know about the text.
The implementation is based on the generic rowan crate on top of which a Rust-specific AST is generated.
The next step in constructing the semantic model is ...
Building a Module Tree
The algorithm for building a tree of modules is to start with a crate root (remember, each Crate from a CrateGraph has a FileId), collect all mod declarations and recursively process child modules.
This is handled by the crate_def_map_query, with two slight variations.
First, rust-analyzer builds a module tree for all crates in a source root simultaneously.
The main reason for this is historical (module_tree predates CrateGraph), but this approach also enables accounting for files which are not part of any crate.
That is, if you create a file but do not include it as a submodule anywhere, you still get semantic completion, and you get a warning about a free-floating module (the actual warning is not implemented yet).
The second difference is that crate_def_map_query does not directly depend on the SourceDatabase::parse query.
Why would calling the parse directly be bad?
Suppose the user changes the file slightly, by adding an insignificant whitespace.
Adding whitespace changes the parse tree (because it includes whitespace), and that means recomputing the whole module tree.
We deal with this problem by introducing an intermediate block_def_map_query.
This query processes the syntax tree and extracts a set of declared submodule names.
Now, changing the whitespace results in block_def_map_query being re-executed for a single module, but because the result of this query stays the same, we do not have to re-execute crate_def_map_query.
In fact, we only need to re-execute it when we add/remove new files or when we change mod declarations.
We store the resulting modules in a Vec-based indexed arena.
The indices in the arena become module IDs.
And this brings us to the next topic: assigning IDs in the general case.
Location Interner pattern
One way to assign IDs is how we have dealt with modules: Collect all items into a single array in some specific order and use the index in the array as an ID. The main drawback of this approach is that these IDs are not stable: Adding a new item can shift the IDs of all other items. This works for modules because adding a module is a comparatively rare operation, but would be less convenient for, for example, functions.
Another solution here is positional IDs: We can identify a function as "the function with name foo in a ModuleId(92) module".
Such locations are stable: adding a new function to the module (unless it is also named foo) does not change the location.
However, such "ID" types cease to be a Copyable integer and in general can become pretty large if we account for nesting (for example: "third parameter of the foo function of the bar impl in the baz module").
Intern and Lookup traits allow us to combine the benefits of positional and numeric IDs.
Implementing both traits effectively creates a bidirectional append-only map between locations and integer IDs (typically newtype wrappers for salsa::InternId) which can "intern" a location and return an integer ID back.
The salsa database we use includes a couple of interners.
How to "garbage collect" unused locations is an open question.
For example, we use Intern and Lookup implementations to assign IDs to definitions of functions, structs, enums, etc.
The location, ItemLoc contains two bits of information:
- the ID of the module which contains the definition,
- the ID of the specific item in the module's source code.
We "could" use a text offset for the location of a particular item, but that would play badly with salsa: offsets change after edits. So, as a rule of thumb, we avoid using offsets, text ranges, or syntax trees as keys and values for queries. What we do instead is we store the "index" of the item among all of the items of a file (so, a positional based ID, but localized to a single file).
One thing we have glossed over for the time being is support for macros. We have only proof of concept handling of macros at the moment, but they are extremely interesting from an "assigning IDs" perspective.
Macros and recursive locations
The tricky bit about macros is that they effectively create new source files.
While we can use FileIds to refer to original files, we cannot just assign them willy-nilly to the pseudo files of macro expansion.
Instead, we use a special ID, HirFileId to refer to either a usual file or a macro-generated file:
enum HirFileId {
  FileId(FileId),
  Macro(MacroCallId),
}
MacroCallId is an interned ID that identifies a particular macro invocation.
Simplifying, it is a HirFileId of a file containing the call plus the offset of the macro call in the file.
Note how HirFileId is defined in terms of MacroCallId which is defined in terms of HirFileId!
This does not recur infinitely though: any chain of HirFileIds bottoms out in HirFileId::FileId, that is, some source file actually written by the user.
Note also that in the actual implementation, the two variants are encoded in a single u32, which are differentiated by the MSB (most significant bit).
If the MSB is 0, the value represents a FileId, otherwise the remaining 31 bits represent a MacroCallId.
Now that we understand how to identify a definition, in a source or in a macro-generated file, we can discuss name resolution a bit.
Name resolution
Name resolution faces the same problem as the module tree: if we look at the syntax tree directly, we will have to recompute name resolution after every modification. The solution to the problem is the same: We lower the source code of each module into a position-independent representation which does not change if we modify bodies of the items. After that, we loop resolving all imports until we have reached a fixed point.
And, given all our preparation with IDs and a position-independent representation, it is satisfying to test that typing inside a function body does not invalidate name resolution results.
An interesting fact about name resolution is that it "erases" all of the intermediate paths from the imports.
In the end, we know which items are defined and which items are imported in each module, but, if the import was use foo::bar::baz, we deliberately forget what modules foo and bar resolve to.
To serve "goto definition" requests on intermediate segments we need this info in the IDE, however.
Luckily, we need it only for a tiny fraction of imports, so we just ask the module explicitly, "What does the path foo::bar resolve to?".
This is a general pattern: we try to compute the minimal possible amount of information during analysis while allowing the IDE to ask for additional specific bits.
Name resolution is also a good place to introduce another salsa pattern used throughout the analyzer:
Source Map pattern
Due to an obscure edge case in completion, the IDE needs to know the syntax node of a use statement that imported the given completion candidate. We cannot just store the syntax node as a part of name resolution: this will break incrementality, due to the fact that syntax changes after every file modification.
We solve this problem during the lowering step of name resolution.
Along with the ItemTree output, the lowering query additionally produces an AstIdMap via an ast_id_map query.
The ItemTree contains imports, but in a position-independent form based on AstId.
The AstIdMap contains a mapping from position-independent AstIds to (position-dependent) syntax nodes.
Type inference
First of all, the implementation of type inference in rust-analyzer was spearheaded by @flodiebold. #327 was an awesome Christmas present, thank you, Florian!
Type inference runs on a per-function granularity and uses the patterns we have discussed previously.
First, we lower the AST of a function body into a position-independent representation.
In this representation, each expression is assigned a positional ID.
Alongside the lowered expression, a source map is produced, which maps between expression ids and original syntax.
This lowering step also deals with "incomplete" source trees by replacing missing expressions with an explicit Missing expression.
Given the lowered body of the function, we can now run type inference and construct a mapping from ExprIds to types.
Tying it all together: completion
To conclude the overview of the rust-analyzer, let us trace the request for (type-inference powered!) code completion!
We start by receiving a message from the language client. We decode the message as a request for completion and schedule it on the threadpool. This is the place where we catch canceled errors if, immediately after completion, the client sends some modification.
In the handler, we deserialize LSP requests into rust-analyzer specific data types (by converting a file URL into a numeric FileId), ask analysis for completion, and serialize results into the LSP.
The completion implementation is finally the place where we start doing the actual work.
The first step is to collect the CompletionContext -- a struct that describes the cursor position in terms of Rust syntax and semantics.
For example, expected_name: Option<NameOrNameReference> is the syntactic representation for the expected name of what we are completing (usually the parameter name of a function argument), while expected_type: Option<Type> is the semantic model for the expected type of what we are completing.
To construct the context, we first do an "IntelliJ Trick": we insert a dummy identifier at the cursor's position and parse this modified file to get a reasonably looking syntax tree.
Then we do a bunch of "classification" routines to figure out the context.
For example, we find a parent fn node, get a semantic model for it (using the lossy source_analyzer infrastructure), and use it to determine the expected type at the cursor position.
The second step is to run a series of independent completion routines.
Let us take a closer look at complete_dot, which completes fields and methods in foo.bar|.
First, we extract a semantic receiver type out of the DotAccess argument.
Then, using the semantic model for the type, we determine if the receiver implements the Future trait, and add a .await completion item in the affirmative case.
Finally, we add all fields & methods from the type to completion.
LSP Extensions
This document describes LSP extensions used by wgsl-analyzer.
It is a best-effort document; when in doubt, consult the source (and send a PR with clarification).
We aim to upstream all non-WESL-specific extensions to the protocol, but this is not a top priority.
All capabilities are enabled via the experimental field of ClientCapabilities or ServerCapabilities.
Requests which we hope to upstream live under the experimental/ namespace.
Requests, which are likely to always remain specific to wgsl-analyzer, are under the wgsl-analyzer/ namespace.
If you want to be notified about the changes to this document, subscribe to #171.
- Configuration in
initializationOptions - Snippet
TextEdit CodeActionGroups- Parent Module
- Join Lines
- On Enter
- Structural Search Replace (SSR)
- Matching Brace
- Open External Documentation
- Local Documentation
- Analyzer Status
- Reload Workspace
- Server Status
- Syntax Tree
- View Syntax Tree
- View File Text
- View ItemTree
- Hover Actions
- Related tests
- Hover Range
- Move Item
- Workspace Symbols Filtering
- Client Commands
- Colored Diagnostic Output
- View Recursive Memory Layout
Configuration in initializationOptions
Upstream Issue: https://github.com/microsoft/language-server-protocol/issues/567
The initializationOptions field of the InitializeParameters of the initialization request should contain the "wgsl-analyzer" section of the configuration.
wgsl-analyzer normally sends a "workspace/configuration" request with { "items": ["wgsl-analyzer"] } payload.
However, the server cannot do this during initialization.
At the same time, some essential configuration parameters are needed early on, before servicing requests.
For this reason, we ask that initializationOptions contain the configuration, as if the server did make a "workspace/configuration" request.
If a language client does not know about wgsl-analyzer's configuration options, it can get sensible defaults by doing any of the following:
- Not sending
initializationOptions - Sending
"initializationOptions": null - Sending
"initializationOptions": {}
Snippet TextEdit
Upstream Issue: https://github.com/microsoft/language-server-protocol/issues/724
Experimental Client Capability: { "snippetTextEdit": boolean }
If this capability is set, WorkspaceEdits returned from codeAction requests
and TextEdits returned from textDocument/onTypeFormatting requests might contain SnippetTextEdits instead of the usual TextEdits:
interface SnippetTextEdit extends TextEdit {
  insertTextFormat?: InsertTextFormat;
  annotationId?: ChangeAnnotationIdentifier;
}
export interface TextDocumentEdit {
  textDocument: OptionalVersionedTextDocumentIdentifier;
  edits: (TextEdit | SnippetTextEdit)[];
}
When applying such code action or text edit, the editor should insert a snippet, with tab stops and placeholders.
At the moment, wgsl-analyzer guarantees that only a single TextDocumentEdit will have edits which can be InsertTextFormat.Snippet.
Any additional TextDocumentEdits will only have edits which are InsertTextFormat.PlainText.
Example
Unresolved Questions
- Where exactly are
SnippetTextEdits allowed (only in code actions at the moment)? - Can snippets span multiple files? (so far, no)
CodeAction Groups
Upstream Issue: https://github.com/microsoft/language-server-protocol/issues/994
Experimental Client Capability: { "codeActionGroup": boolean }
If this capability is set, CodeActions returned from the server contain an additional field, group:
interface CodeAction {
  title: string;
  group?: string;
  ...
}
All code actions with the same group should be grouped under a single (extendable) entry in the lightbulb menu.
The set of actions [ { title: "foo" }, { group: "frobnicate", title: "bar" }, { group: "frobnicate", title: "baz" }] should be rendered as
💡
  +-------------+
  | foo         |
  +-------------+-----+
  | frobnicate >| bar |
  +-------------+-----+
                | baz |
                +-----+
Alternatively, selecting frobnicate could present a user with an additional menu to choose between bar and baz.
Example
fn foo() {
    let x: Entry/*cursor here*/ = todo!();
}
Invoking code action at this position will yield two code actions for importing Entry from either collections::HashMap or collection::BTreeMap, grouped under a single "import" group.
Unresolved Questions
- Is a fixed two-level structure enough?
- Should we devise a general way to encode custom interaction protocols for GUI refactorings?
Parent Module
Upstream Issue: https://github.com/microsoft/language-server-protocol/issues/1002
Experimental Server Capability: { "parentModule": boolean }
This request is sent from client to server to handle "Goto Parent Module" editor action.
Method: experimental/parentModule
Request: TextDocumentPositionParameters
Response: Location | Location[] | LocationLink[] | null
Unresolved Question
- An alternative would be to use a more general "gotoSuper" request, which would work for super methods, super classes, and super modules. This is the approach IntelliJ Rust is taking. However, experience shows that super module (which generally has a feeling of navigation between files) should be separate. If you want super module, but the cursor happens to be inside an overridden function, the behavior with a single "gotoSuper" request is surprising.
Join Lines
Upstream Issue: https://github.com/microsoft/language-server-protocol/issues/992
Experimental Server Capability: { "joinLines": boolean }
This request is sent from client to server to handle "Join Lines" editor action.
Method: experimental/joinLines
Request:
interface JoinLinesParameters {
    textDocument: TextDocumentIdentifier,
    /// Currently active selections/cursor offsets.
    /// This is an array to support multiple cursors.
    ranges: Range[],
}
Response: TextEdit[]
Example
fn main() {
    /*cursor here*/let x = {
        92
    };
}
experimental/joinLines yields (curly braces are automagically removed)
fn foo() {
    let x = 92;
}
Unresolved Question
- What is the position of the cursor after
joinLines? Currently, this is left to editor's discretion, but it might be useful to specify on the server via snippets. However, it then becomes unclear how it works with multi cursor.
On Enter
Upstream Issue: https://github.com/microsoft/language-server-protocol/issues/1001
Experimental Server Capability: { "onEnter": boolean }
This request is sent from client to server to handle the Enter key press.
Method: experimental/onEnter
Request: TextDocumentPositionParameters
Response:
SnippetTextEdit[]
Example
fn foo() {
    // Some /*cursor here*/ docs
    let x = 92;
}
experimental/onEnter returns the following snippet
fn foo() {
    // Some
    // $0 docs
    let x = 92;
}
The primary goal of onEnter is to handle automatic indentation when opening a new line.
This is not yet implemented.
The secondary goal is to handle fixing up syntax, like continuing doc strings and comments, and escaping \n in string literals.
As proper cursor positioning is the main purpose of onEnter, it uses SnippetTextEdit.
Unresolved Question
- How to deal with synchronicity of the request? One option is to require the client to block until the server returns the response. Another option is to do an operational transforms style merging of edits from client and server. A third option is to do a record-replay: client applies heuristic on enter immediately, then applies all the user's keypresses. When the server is ready with the response, the client rollbacks all the changes and applies the recorded actions on top of the correct response.
- How to deal with multiple carets?
- Should we extend this to arbitrary typed events and not just
onEnter?
Structural Search Replace (SSR)
Experimental Server Capability: { "ssr": boolean }
This request is sent from client to server to handle structural search replace -- automated syntax tree based transformation of the source.
Method: experimental/ssr
Request:
interface SsrParameters {
    /// Search query.
    /// The specific syntax is specified outside of the protocol.
    query: string,
    /// If true, only check the syntax of the query and do not compute the actual edit.
    parseOnly: boolean,
    /// The current text document.
    /// This and `position` will be used to determine in what scope paths in `query` should be resolved.
    textDocument: TextDocumentIdentifier;
    /// Position where SSR was invoked.
    position: Position;
    /// Current selections.
    /// Search/replace will be restricted to these if non-empty.
    selections: Range[];
}
Response:
WorkspaceEdit
Example
SSR with query foo($a, $b) ==>> ($a).foo($b) will transform, eg foo(y + 5, z) into (y + 5).foo(z).
Unresolved Question
- Probably needs search without replace mode
- Needs a way to limit the scope to certain files.
Matching Brace
Upstream Issue: https://github.com/microsoft/language-server-protocol/issues/999
Experimental Server Capability: { "matchingBrace": boolean }
This request is sent from client to server to handle "Matching Brace" editor action.
Method: experimental/matchingBrace
Request:
interface MatchingBraceParameters {
    textDocument: TextDocumentIdentifier,
    /// Position for each cursor
    positions: Position[],
}
Response:
Position[]
Example
fn main() {
  let x: array<()/*cursor here*/> = array();
}
experimental/matchingBrace yields the position of <.
In many cases, matching braces can be handled by the editor.
However, some cases (like disambiguating between generics and comparison operations) need a real parser.
Moreover, it would be cool if editors did not need to implement even basic language parsing.
Unresolved Question
- Should we return a nested brace structure, to allow paredit-like actions of jump out of the current brace pair?
This is how
SelectionRangerequest works. - Alternatively, should we perhaps flag certain
SelectionRanges as being brace pairs?
Open External Documentation
This request is sent from the client to the server to obtain web and local URL(s) for documentation related to the symbol under the cursor, if available.
Method: experimental/externalDocs
Request: TextDocumentPositionParameters
Response: string | null
Local Documentation
Experimental Client Capability: { "localDocs": boolean }
If this capability is set, the Open External Documentation request returned from the server will have the following structure:
interface ExternalDocsResponse {
    web?: string;
    local?: string;
}
Analyzer Status
Method: wgsl-analyzer/analyzerStatus
Request:
interface AnalyzerStatusParameters {
    textDocument?: TextDocumentIdentifier;
}
Response: string
Returns internal status message, mostly for debugging purposes.
Reload Workspace
Method: wgsl-analyzer/reloadWorkspace
Request: null
Response: null
Reloads project information (that is, re-executes cargo metadata).
Server Status
Experimental Client Capability: { "serverStatusNotification": boolean }
Method: experimental/serverStatus
Notification:
interface ServerStatusParameters {
    /// `ok` means that the server is completely functional.
    ///
    /// `warning` means that the server is partially functional.
    /// It can answer correctly to most requests, but some results
    /// might be wrong due to, for example, some missing dependencies.
    ///
    /// `error` means that the server is not functional.
    /// For example, there is a fatal build configuration problem.
    /// The server might still give correct answers to simple requests,
    /// but most results will be incomplete or wrong.
    health: "ok" | "warning" | "error",
    /// Is there any pending background work which might change the status?
    /// For example, are dependencies being downloaded?
    quiescent: boolean,
    /// Explanatory message to show on hover.
    message?: string,
}
This notification is sent from server to client.
The client can use it to display persistent status to the user (in modline).
It is similar to the showMessage, but is intended for states rather than point-in-time events.
Note that this functionality is intended primarily to inform the end user about the state of the server.
In particular, it is valid for the client to completely ignore this extension.
Clients are discouraged from but are allowed to use the health status to decide if it is worth sending a request to the server.
Controlling Flycheck
The flycheck/checkOnSave feature can be controlled via notifications sent by the client to the server.
Method: wgsl-analyzer/runFlycheck
Notification:
interface RunFlycheckParameters {
    /// The text document whose cargo workspace flycheck process should be started.
    /// If the document is null or does not belong to a cargo workspace all flycheck processes will be started.
    textDocument: lc.TextDocumentIdentifier | null;
}
Triggers the flycheck processes.
Method: wgsl-analyzer/clearFlycheck
Notification:
interface ClearFlycheckParameters {}
Clears the flycheck diagnostics.
Method: wgsl-analyzer/cancelFlycheck
Notification:
interface CancelFlycheckParameters {}
Cancels all running flycheck processes.
Syntax Tree
Method: wgsl-analyzer/syntaxTree
Request:
interface SyntaxTreeParameters {
    textDocument: TextDocumentIdentifier,
    range?: Range,
}
Response: string
Returns textual representation of a parse tree for the file/selected region. Primarily for debugging, but very useful for all people working on wgsl-analyzer itself.
View Syntax Tree
Method: wgsl-analyzer/viewSyntaxTree
Request:
interface ViewSyntaxTreeParameters {
    textDocument: TextDocumentIdentifier,
}
Response: string
Returns json representation of the file's syntax tree. Used to create a treeView for debugging and working on wgsl-analyzer itself.
View File Text
Method: wgsl-analyzer/viewFileText
Request: TextDocumentIdentifier
Response: string
Returns the text of a file as seen by the server. This is for debugging file sync problems.
View ItemTree
Method: wgsl-analyzer/viewItemTree
Request:
interface ViewItemTreeParameters {
    textDocument: TextDocumentIdentifier,
}
Response: string
Returns a textual representation of the ItemTree of the currently open file, for debugging.
Hover Actions
Experimental Client Capability: { "hoverActions": boolean }
If this capability is set, the Hover request returned from the server might contain an additional field, actions:
interface Hover {
    ...
    actions?: CommandLinkGroup[];
}

interface CommandLink extends Command {
    /**
     * A tooltip for the command, when represented in the UI.
     */
    tooltip?: string;
}

interface CommandLinkGroup {
    title?: string;
    commands: CommandLink[];
}
Such actions on the client side are appended to a hover bottom as command links:
  +-----------------------------+
  | Hover content               |
  |                             |
  +-----------------------------+
  | _Action1_ | _Action2_       |  <- first group, no TITLE
  +-----------------------------+
  | TITLE _Action1_ | _Action2_ |  <- second group
  +-----------------------------+
  ...
Related tests
This request is sent from client to server to get the list of tests for the specified position.
Method: wgsl-analyzer/relatedTests
Request: TextDocumentPositionParameters
Response: TestInfo[]
interface TestInfo {
    runnable: Runnable;
}
Hover Range
Upstream Issue: https://github.com/microsoft/language-server-protocol/issues/377
Experimental Server Capability: { "hoverRange": boolean }
This extension allows passing a Range as a position field of HoverParameters.
The primary use-case is to use the hover request to show the type of the expression currently selected.
interface HoverParameters extends WorkDoneProgressParameters {
    textDocument: TextDocumentIdentifier;
    position: Range | Position;
}
Whenever the client sends a Range, it is understood as the current selection and any hover included in the range will show the type of the expression if possible.
Example
fn main() {
    let expression = $01 + 2 * 3$0;
}
Triggering a hover inside the selection above will show a result of i32.
Move Item
Upstream Issue: https://github.com/rust-lang/rust-analyzer/issues/6823
This request is sent from client to server to move item under cursor or selection in some direction.
Method: experimental/moveItem
Request: MoveItemParameters
Response: SnippetTextEdit[]
export interface MoveItemParameters {
    textDocument: TextDocumentIdentifier,
    range: Range,
    direction: Direction
}

export const enum Direction {
    Up = "Up",
    Down = "Down"
}
Workspace Symbols Filtering
Upstream Issue: https://github.com/microsoft/language-server-protocol/issues/941
Experimental Server Capability: { "workspaceSymbolScopeKindFiltering": boolean }
Extends the existing workspace/symbol request with ability to filter symbols by broad scope and kind of symbol.
If this capability is set, workspace/symbol parameter gains two new optional fields:
interface WorkspaceSymbolParameters {
    /**
     * Return only the symbols of specified kinds.
     */
    searchKind?: WorkspaceSymbolSearchKind;
    ...
}

const enum WorkspaceSymbolSearchKind {
    OnlyTypes = "onlyTypes",
    AllSymbols = "allSymbols"
}
Client Commands
Upstream Issue: https://github.com/microsoft/language-server-protocol/issues/642
Experimental Client Capability: { "commands?": ClientCommandOptions }
Certain LSP types originating on the server, notably code lenses, embed commands. Commands can be serviced either by the server or by the client. However, the server does not know which commands are available on the client.
This extensions allows the client to communicate this info.
export interface ClientCommandOptions {
    /**
     * The commands to be executed on the client
     */
    commands: string[];
}
Colored Diagnostic Output
Experimental Client Capability: { "colorDiagnosticOutput": boolean }
If this capability is set, the "full compiler diagnostics" provided by checkOnSave
will include ANSI color and style codes to render the diagnostic in a similar manner
as cargo. This is translated into --message-format=json-diagnostic-rendered-ansi
when flycheck is run, instead of the default --message-format=json.
The full compiler rendered diagnostics are included in the server response regardless of this capability:
// https://microsoft.github.io/language-server-protocol/specifications/specification-current#diagnostic
export interface Diagnostic {
    ...
    data?: {
        /**
         * The human-readable compiler output as it would be printed to a terminal.
         * Includes ANSI color and style codes if the client has set the experimental
         * `colorDiagnosticOutput` capability.
         */
        rendered?: string;
    };
}
View Recursive Memory Layout
Method: wgsl-analyzer/viewRecursiveMemoryLayout
Request: TextDocumentPositionParameters
Response:
export interface RecursiveMemoryLayoutNode = {
    /// Name of the item, or [ROOT], `.n` for tuples
    item_name: string;
    /// Full name of the type (type aliases are ignored)
    typename: string;
    /// Size of the type in bytes
    size: number;
    /// Alignment of the type in bytes
    alignment: number;
    /// Offset of the type relative to its parent (or 0 if its the root)
    offset: number;
    /// Index of the node's parent (or -1 if its the root)
    parent_index: number;
    /// Index of the node's children (or -1 if it does not have children)
    children_start: number;
    /// Number of child nodes (unspecified it does not have children)
    children_length: number;
};

export interface RecursiveMemoryLayout = {
    nodes: RecursiveMemoryLayoutNode[];
};
Returns a vector of nodes representing items in the datatype as a tree, RecursiveMemoryLayout::nodes[0] is the root node.
If RecursiveMemoryLayout::nodes::length == 0 we could not find a suitable type.
Generic Types do not give anything because they are incomplete. Fully specified generic types do not give anything if they are selected directly but do work when a child of other types this is consistent with other behavior.
Unresolved questions
- How should enums/unions be represented? currently they do not produce any children because they have multiple distinct sets of children.
- Should niches be represented? currently they are not reported.
- A visual representation of the memory layout is not specified, see the provided implementation for an example, however it may not translate well to terminal based editors or other such things.
Setup Guide
This guide gives a simplified, opinionated setup for developers contributing to wgsl-analyzer using Visual Studio Code.
It enables developers to make changes and Visual Studio Code Insiders to test those changes.
This guide will assume you have Visual Studio Code and Visual Studio Code Insiders installed.
Prerequisites
Since wgsl-analyzer is a Rust project, you will need to install Rust.
You can download and install the latest stable version of Rust.
Step-by-Step Setup
- Fork the
wgsl-analyzerrepository and clone the fork to your local machine. - Open the project in Visual Studio Code.
- Open a terminal and run
cargo buildto build the project. - Install the language server locally by running the following command:
cargo xtask install --server --code-bin code-insiders --dev-rel
In the output of this command, there should be a file path provided to the installed binary on your local machine. It should look something like the following output below:
Installing <path-to-wgsl-analyzer-binary>
Installed package `wgsl-analyzer v0.0.0 (<path-to-wgsl-analyzer-binary>)` (executable `wgsl-analyzer.exe`)
In Visual Studio Code Insiders, you will want to open your User Settings (JSON) from the Command Palette.
From there, you should ensure that the wgsl-analyzer.server.path key is set to the <path-to-wgsl-analyzer-binary>.
This will tell Visual Studio Code Insiders to use the locally installed version that you can debug.
The User Settings (JSON) file should contain the following:
{
    "wgsl-analyzer.server.path": "<path-to-wgsl-analyzer-binary>"
}
Now you should be able to make changes to wgsl-analyzer in Visual Studio Code and then view the changes in Visual Studio Code Insiders.
Debugging wgsl-analyzer
The simplest way to debug wgsl-analyzer is to use the eprintln! macro.
The reason why we use eprintln! instead of println! is because the language server uses stdout to send messages.
Instead, debug using stderr.
An example debugging statement could go into the main_loop.rs file which can be found at crates/wgsl-analyzer/src/main_loop.rs.
Inside the main_loop add the following eprintln! to test debugging wgsl-analyzer:
eprintln!("Hello, world!");Now we run cargo build and cargo xtask install --server --code-bin code-insiders --dev-rel to reinstall the server.
Now on Visual Studio Code Insiders, we should be able to open the Output tab on our terminal and switch to wgsl-analyzer Language Server to see the eprintln! statement we just wrote.
If you are able to see your output, you now have a complete workflow for debugging wgsl-analyzer.
Style
Our approach to "clean code" is two-fold:
- We generally do not block PRs on style changes.
- At the same time, all code in
wgsl-analyzeris constantly refactored.
It is explicitly OK for a reviewer to flag only some nits in the PR, and then send a follow-up cleanup PR for things which are easier to explain by example, cc-ing the original author. Sending small cleanup PRs (like renaming a single local variable) is encouraged.
When reviewing pull requests, prefer extending this document to leaving non-reusable comments on the pull request itself.
General
Scale of Changes
Everyone knows that it is better to send small & focused pull requests. The problem is, sometimes you have to, e.g., rewrite the whole compiler, and that just does not fit into a set of isolated PRs.
The main things to keep an eye on are the boundaries between various components. There are three kinds of changes:
-
Internals of a single component are changed. Specifically, you do not change any
pubitems. A good example here would be an addition of a new assist. -
API of a component is expanded. Specifically, you add a new
pubfunction which was not there before. A good example here would be the expansion of the assist API, for example, to implement lazy assists or assist groups. -
A new dependency between components is introduced. Specifically, you add a
pub usere-export from another crate or you add a new line to the[dependencies]section ofCargo.toml. A good example here would be adding reference search capability to the assists crate.
For the first group, the change is generally merged as long as:
- it works for the happy case,
- it has tests,
- it does not panic for the unhappy case.
For the second group, the change would be subjected to quite a bit of scrutiny and iteration. The new API needs to be right (or at least easy to change later). The actual implementation does not matter that much. It is very important to minimize the number of changed lines of code for changes of the second kind. Often, you start doing a change of the first kind, only to realize that you need to elevate to a change of the second kind. In this case, we will probably ask you to split API changes into a separate PR.
Changes of the third group should be pretty rare, so we do not specify any specific process for them.
That said, adding an innocent-looking pub use is a very simple way to break encapsulation, keep an eye on it!
Note: if you enjoyed this abstract hand-waving about boundaries, you might appreciate https://www.tedinski.com/2018/02/06/system-boundaries.html.
Crates.io Dependencies
We try to be very conservative with the usage of crates.io dependencies.
Do not use small "helper" crates (exception: itertools and either are allowed).
If there is some general reusable bit of code you need, consider adding it to the stdx crate.
A useful exercise is to read Cargo.lock and see if some transitive dependencies do not make sense for wgsl-analyzer.
Rationale: keep compile times low, create ecosystem pressure for faster compiles, reduce the number of things which might break.
Commit Style
We do not have specific rules around git history hygiene. Maintaining clean git history is strongly encouraged, but not enforced. Use rebase workflow, it is OK to rewrite history during the PR review process. After you are happy with the state of the code, please use interactive rebase to squash fixup commits.
Avoid @mentioning people in commit messages and pull request descriptions (they are added to commit messages by bors). Such messages create a lot of duplicate notification traffic during rebases.
If possible, write Pull Request titles and descriptions from the user's perspective:
## GOOD
Make goto definition work inside macros

## BAD
Use original span for FileId
This makes it easier to prepare a changelog.
If the change adds a new user-visible functionality, consider recording a GIF with peek and pasting it into the PR description.
To make writing the release notes easier, you can mark a pull request as a feature, fix, internal change, or minor. Minor changes are excluded from the release notes, while the other types are distributed in their corresponding sections. There are two ways to mark this:
- use a
feat:,feature:,fix:,internal:, orminor:prefix in the PR title - write
changelog [feature|fix|internal|skip] [description]in a comment or in the PR description; the description is optional and will replace the title if included.
These comments do not have to be added by the PR author. Editing a comment or the PR description or title is also fine, as long as it happens before the release.
Rationale: clean history is potentially useful, but rarely used. But many users read changelogs. Including a description and GIF suitable for the changelog means less work for the maintainers on the release day.
Clippy
We use Clippy to improve the code, but if some lints annoy you, allow them in the Cargo.toml [workspace.lints.clippy] section.
Code
Minimal Tests
Most tests in wgsl-analyzer start with a snippet of WESL code.
These snippets should be minimal.
If you copy-paste a snippet of real code into the tests, make sure to remove everything which could be removed.
It also makes sense to format snippets more compactly (for example, by placing enum definitions like enum E { Foo, Bar } on a single line), as long as they are still readable.
When using multiline fixtures, use unindented raw string literals:
    #[test]
    fn inline_field_shorthand() {
        check_assist(
            inline_local_variable,
            r#"
struct S { foo: i32}
fn main() {
    let $0foo = 92;
    S { foo }
}
"#,
            r#"
struct S { foo: i32}
fn main() {
    S { foo: 92 }
}
"#,
        );
    }
Rationale:
There are many benefits to this:
- less to read or to scroll past
- easier to understand what exactly is tested
- less stuff printed during printf-debugging
- less time to run tests
Formatting ensures that you can use your editor's "number of selected characters" feature to correlate offsets with tests' source code.
Marked Tests
Use cov_mark::hit! / cov_mark::check! when testing specific conditions.
Do not place several marks into a single test or condition.
Do not reuse marks between several tests.
Rationale: marks provide an easy way to find the canonical test for each bit of code. This makes it much easier to understand. More than one mark per test / code branch does not add significantly to understanding.
#[should_panic]
Do not use #[should_panic] tests.
Instead, explicitly check for None, Err, etc.
Rationale: #[should_panic] is a tool for library authors to make sure that the API does not fail silently when misused.
wgsl-analyzer is not a library.
We do not need to test for API misuse, and we have to handle any user input without panics.
Panic messages in the logs from the #[should_panic] tests are confusing.
#[ignore]
Do not #[ignore] tests.
If the test currently does not work, assert the wrong behavior and add a fixme explaining why it is wrong.
Rationale: noticing when the behavior is fixed, making sure that even the wrong behavior is acceptable (i.e., not a panic).
Function Preconditions
Express function preconditions in types and force the caller to provide them (rather than checking in callee):
// GOOD
fn frobnicate(walrus: Walrus) {
    ...
}

// BAD
fn frobnicate(walrus: Option<Walrus>) {
    let walrus = match walrus {
        Some(it) => it,
        None => return,
    };
    ...
}
Rationale: this makes control flow explicit at the call site. Call-site has more context. It often happens that the precondition falls out naturally or can be bubbled up higher in the stack.
Avoid splitting precondition check and precondition use across functions:
// GOOD
fn main() {
    let string: &str = ...;
    if let Some(contents) = string_literal_contents(string) {

    }
}

fn string_literal_contents(string: &str) -> Option<&str> {
    if string.starts_with('"') && string.ends_with('"') {
        Some(&string[1..string.len() - 1])
    } else {
        None
    }
}

// BAD
fn main() {
    let string: &str = ...;
    if is_string_literal(string) {
        let contents = &string[1..string.len() - 1];
    }
}

fn is_string_literal(string: &str) -> bool {
    string.starts_with('"') && string.ends_with('"')
}
In the "Not as good" version, the precondition that 1 is a valid char boundary is checked in is_string_literal and used in foo.
In the "Good" version, the precondition check and usage are checked in the same block, and then encoded in the types.
Rationale: non-local code properties degrade under change.
When checking a boolean precondition, prefer if !invariant to if negated_invariant:
// GOOD
if !(index < length) {
    return None;
}

// BAD
if index >= length {
    return None;
}
Rationale: it is useful to see the invariant relied upon by the rest of the function clearly spelled out.
Control Flow
As a special case of the previous rule, do not hide control flow inside functions, push it to the caller:
// GOOD
if cond {
    foo();
}

fn foo() {
  ...
}

// BAD
bar();

fn bar() {
    if !cond {
        return;
    }
    ...
}
Assertions
Assert liberally.
Prefer stdx::never! to standard assert!.
Rationale: See cross cutting concern: error handling.
Getters & Setters
If a field can have any value without breaking invariants, make the field public. Conversely, if there is an invariant, document it, enforce it in the "constructor" function, make the field private, and provide a getter. Never provide setters.
Getters should return borrowed data:
struct Person {
    // Invariant: never empty
    first_name: String,
    middle_name: Option<String>
}

// GOOD
impl Person {
    fn first_name(&self) -> &str { self.first_name.as_str() }
    fn middle_name(&self) -> Option<&str> { self.middle_name.as_ref() }
}

// BAD
impl Person {
    fn first_name(&self) -> String { self.first_name.clone() }
    fn middle_name(&self) -> &Option<String> { &self.middle_name }
}
Rationale: we do not provide public API.
It is cheaper to refactor than to pay getters rent.
Non-local code properties degrade under change.
Privacy makes invariant local.
Borrowed owned types (&String) disclose irrelevant details about internal representation.
Irrelevant (neither right nor wrong) things obscure correctness.
Useless Types
More generally, always prefer types on the left
// GOOD      BAD
&[T]         &Vec<T>
&str         &String
Option<&T>   &Option<T>
&Path        &PathBuf
Rationale: types on the left are strictly more general. Even when generality is not required, consistency is important.
Constructors
Prefer Default to zero-argument new function.
// GOOD
#[derive(Default)]
struct Foo {
    bar: Option<Bar>
}

// BAD
struct Foo {
    bar: Option<Bar>
}

impl Foo {
    fn new() -> Foo {
        Foo { bar: None }
    }
}
Prefer Default even if it has to be implemented manually.
Rationale: less typing in the common case, uniformity.
Use Vec::new rather than vec![].
Rationale: uniformity, strength reduction.
Avoid using "dummy" states to implement a Default.
If a type does not have a sensible default, empty value, do not hide it.
Let the caller explicitly decide what the right initial state is.
Functions Over Objects
Avoid creating "doer" objects. That is, objects which are created only to execute a single action.
// GOOD
do_thing(arg1, arg2);

// BAD
ThingDoer::new(arg1, arg2).do();
Note that this concerns only outward API.
When implementing do_thing, it might be very useful to create a context object.
pub fn do_thing(
  an_input: Argument1,
  another_input: Argument2,
) -> Result {
    let mut context = Context { an_input, another_input };
    context.run()
}

struct Context {
    an_input: Argument1,
    another_input: Argument2,
}

impl Context {
    fn run(self) -> Result {
        ...
    }
}
The difference is that Context is an implementation detail here.
Sometimes a middle ground is acceptable if this can save some busywork:
ThingDoer::do(an_input, another_input);

pub struct ThingDoer {
    an_input: Argument1,
    another_input: Argument2,
}

impl ThingDoer {
    pub fn do(
        an_input: Argument1,
        another_input: Argument2,
    ) -> Result {
        ThingDoer { an_input, another_input }.run()
    }

    fn run(self) -> Result {
        ...
    }
}
Rationale: not bothering the caller with irrelevant details, not mixing user API with implementor API.
Functions with many parameters
Avoid creating functions with many optional or boolean parameters.
Introduce a Config struct instead.
// GOOD
pub struct AnnotationConfig {
    pub binary_target: bool,
    pub annotate_runnables: bool,
    pub annotate_impls: bool,
}

pub fn annotations(
    db: &RootDatabase,
    file_id: FileId,
    config: AnnotationConfig
) -> Vec<Annotation> {
    ...
}

// BAD
pub fn annotations(
    db: &RootDatabase,
    file_id: FileId,
    binary_target: bool,
    annotate_runnables: bool,
    annotate_impls: bool,
) -> Vec<Annotation> {
    ...
}
Rationale: reducing churn. If the function has many parameters, they most likely change frequently. By packing them into a struct we protect all intermediary functions from changes.
Do not implement Default for the Config struct, the caller has more context to determine better defaults.
Do not store Config as a part of the state, pass it explicitly.
This gives more flexibility for the caller.
If there is variation not only in the input parameters, but in the return type as well, consider introducing a Command type.
// MAYBE GOOD
pub struct Query {
    pub name: String,
    pub case_sensitive: bool,
}

impl Query {
    pub fn all(self) -> Vec<Item> { ... }
    pub fn first(self) -> Option<Item> { ... }
}

// MAYBE BAD
fn query_all(name: String, case_sensitive: bool) -> Vec<Item> { ... }
fn query_first(name: String, case_sensitive: bool) -> Option<Item> { ... }
Prefer Separate Functions Over Parameters
If a function has a bool or an Option parameter, and it is always called with true, false, Some and None literals, split the function in two.
// GOOD
fn caller_a() {
    foo()
}

fn caller_b() {
    foo_with_bar(Bar::new())
}

fn foo() { ... }
fn foo_with_bar(bar: Bar) { ... }

// BAD
fn caller_a() {
    foo(None)
}

fn caller_b() {
    foo(Some(Bar::new()))
}

fn foo(bar: Option<Bar>) { ... }
Rationale: more often than not, such functions display "false sharing" -- they have additional if branching inside for two different cases.
Splitting the two different control flows into two functions simplifies each path, and remove cross-dependencies between the two paths.
If there is common code between foo and foo_with_bar, extract that into a common helper.
Appropriate String Types
When interfacing with OS APIs, use OsString, even if the original source of data is utf-8 encoded.
Rationale: cleanly delineates the boundary when the data goes into the OS-land.
Use AbsPathBuf and AbsPath over std::Path.
Rationale: wgsl-analyzer is a long-lived process which handles several projects at the same time.
It is important not to leak cwd by accident.
Premature Pessimization
Avoid Allocations
Avoid writing code which is slower than it needs to be.
Do not allocate a Vec where an iterator would do, do not allocate strings needlessly.
// GOOD
use itertools::Itertools;

let (first_word, second_word) = match text.split_ascii_whitespace().collect_tuple() {
    Some(it) => it,
    None => return,
}

// BAD
let words = text.split_ascii_whitespace().collect::<Vec<_>>();
if words.len() != 2 {
    return
}
Rationale: not allocating is almost always faster.
Push Allocations to the Call Site
If allocation is inevitable, let the caller allocate the resource:
// GOOD
fn frobnicate(string: String) {
    ...
}

// BAD
fn frobnicate(string: &str) {
    let string = string.to_string();
    ...
}
Rationale: reveals the costs. It is also more efficient when the caller already owns the allocation.
Collection Types
Prefer rustc_hash::FxHashMap and rustc_hash::FxHashSet instead of the ones in std::collections.
Rationale: they use a hasher that is significantly faster and using them consistently will reduce code size by some small amount.
Avoid Intermediate Collections
When writing a recursive function to compute a set of things, use an accumulator parameter instead of returning a fresh collection. The accumulator goes first in the list of arguments.
// GOOD
pub fn reachable_nodes(node: Node) -> FxHashSet<Node> {
    let mut result = FxHashSet::default();
    go(&mut result, node);
    result
}
fn go(acc: &mut FxHashSet<Node>, node: Node) {
    acc.insert(node);
    for n in node.neighbors() {
        go(acc, n);
    }
}

// BAD
pub fn reachable_nodes(node: Node) -> FxHashSet<Node> {
    let mut result = FxHashSet::default();
    result.insert(node);
    for n in node.neighbors() {
        result.extend(reachable_nodes(n));
    }
    result
}
Rationale: re-use allocations, accumulator style is more concise for complex cases.
Avoid Monomorphization
Avoid making a lot of code type parametric, especially on the boundaries between crates.
// GOOD
fn frobnicate(function: impl FnMut()) {
    frobnicate_impl(&mut function)
}
fn frobnicate_impl(function: &mut dyn FnMut()) {
    // lots of code
}

// BAD
fn frobnicate(function: impl FnMut()) {
    // lots of code
}
Avoid AsRef polymorphism, it pays back only for widely used libraries:
// GOOD
fn frobnicate(foo: &Path) {
}

// BAD
fn frobnicate(foo: impl AsRef<Path>) {
}
Rationale: Rust uses monomorphization to compile generic code, meaning that for each instantiation of a generic function with concrete types, the function is compiled afresh, per crate. This allows for exceptionally good performance, but leads to increased compile times. Runtime performance obeys the 80%/20% rule -- only a small fraction of code is hot. Compile time does not obey this rule -- all code has to be compiled.
Code Style
Order of Imports
Separate import groups with blank lines.
Use one use per crate.
Module declarations come before the imports. Order them in "suggested reading order" for a person new to the code base.
mod x;
mod y;

// First std.
use std::{ ... }

// Second, external crates (both crates.io crates and other wgsl-analyzer crates).
use crate_foo::{ ... }
use crate_bar::{ ... }

// Then current crate.
use crate::{}

// Finally, parent and child modules, but prefer `use crate::`.
use super::{}

// Re-exports are treated as item definitions rather than imports, so they go
// after imports and modules. Use them sparingly.
pub use crate::x::Z;
Rationale: consistency. Reading order is important for new contributors. Grouping by crate allows spotting unwanted dependencies easier.
Import Style
Qualify items from hir and ast.
// GOOD
use syntax::ast;

fn frobnicate(func: hir::Function, r#struct: ast::Struct) {}

// BAD
use hir::Function;
use syntax::ast::Struct;

fn frobnicate(func: Function, r#struct: Struct) {}
Rationale: avoids name clashes, makes the layer clear at a glance.
When implementing traits from std::fmt or std::ops, import the module:
// GOOD
use std::fmt;

impl fmt::Display for RenameError {
    fn fmt(&self, formatter: &mut fmt::Formatter<'_>) -> fmt::Result { .. }
}

// BAD
impl std::fmt::Display for RenameError {
    fn fmt(&self, formatter: &mut std::fmt::Formatter<'_>) -> std::fmt::Result { .. }
}

// BAD
use std::ops::Deref;

impl Deref for Widget {
    type Target = str;
    fn deref(&self) -> &str { .. }
}
Rationale: overall, less typing. Makes it clear that a trait is implemented, rather than used.
Avoid local use MyEnum::* imports.
Rationale: consistency.
Prefer use crate::foo::bar to use super::bar or use self::bar::baz.
Rationale: consistency, this is the style which works in all cases.
By default, avoid re-exports. Rationale: for non-library code, re-exports introduce two ways to use something and allow for inconsistency.
Order of Items
Optimize for the reader who sees the file for the first time, and wants to get a general idea about what is going on. People read things from top to bottom, so place most important things first.
Specifically, if all items except one are private, always put the non-private item on top.
// GOOD
pub(crate) fn frobnicate() {
    Helper::act()
}

#[derive(Default)]
struct Helper { stuff: i32 }

impl Helper {
    fn act(&self) {

    }
}

// BAD
#[derive(Default)]
struct Helper { stuff: i32 }

pub(crate) fn frobnicate() {
    Helper::act()
}

impl Helper {
    fn act(&self) {

    }
}
If there is a mixture of private and public items, put public items first.
Put structs and enums first, functions and impls last. Order type declarations in top-down manner.
// GOOD
struct Parent {
    children: Vec<Child>
}

struct Child;

impl Parent {
}

impl Child {
}

// BAD
struct Child;

impl Child {
}

struct Parent {
    children: Vec<Child>
}

impl Parent {
}
Rationale: easier to get the sense of the API by visually scanning the file. If function bodies are folded in the editor, the source code should read as documentation for the public API.
Context Parameters
Some parameters are threaded unchanged through many function calls.
They determine the "context" of the operation.
Pass such parameters first, not last.
If there are several context parameters, consider packing them into a struct Ctx and passing it as &self.
// GOOD
fn dfs(graph: &Graph, v: Vertex) -> usize {
    let mut visited = FxHashSet::default();
    return go(graph, &mut visited, v);

    fn go(graph: &Graph, visited: &mut FxHashSet<Vertex>, v: usize) -> usize {
        ...
    }
}

// BAD
fn dfs(v: Vertex, graph: &Graph) -> usize {
    fn go(v: usize, graph: &Graph, visited: &mut FxHashSet<Vertex>) -> usize {
        ...
    }

    let mut visited = FxHashSet::default();
    go(v, graph, &mut visited)
}
Rationale: consistency. Context-first works better when non-context parameter is a lambda.
Variable Naming
https://www.youtube.com/watch?v=-J3wNP6u5YU
Use boring and long names for local variables (yay code completion).
The default name is a lowercased name of the type: global_state: GlobalState.
Avoid all acronyms and contractions unless it is overwhelmingly appropriate.
Use American spelling (color, behavior).
Many names in wgsl-analyzer conflict with keywords.
We use r#ident syntax where necessary.
crate  -> r#crate
enum   -> r#enum
fn     -> r#fn
impl   -> r#impl
mod    -> r#mod
struct -> r#struct
trait  -> r#trait
type   -> r#type
Rationale: idiomatic, clarity.
Error Handling Trivia
Prefer anyhow::Result over Result.
Rationale: makes it immediately clear what result that is.
Prefer anyhow::format_err! over anyhow::anyhow.
Rationale: consistent, boring, avoids stuttering.
Error messages are typically concise lowercase sentences without trailing punctuation.
Early Returns
Do use early returns
// GOOD
fn foo() -> Option<Bar> {
    if !condition() {
        return None;
    }

    Some(...)
}

// BAD
fn foo() -> Option<Bar> {
    if condition() {
        Some(...)
    } else {
        None
    }
}
Rationale: reduce cognitive stack usage.
Use return Err(error) to "throw" an error:
// GOOD
fn foo() -> Result<(), ()> {
    if condition {
        return Err(());
    }
    Ok(())
}

// BAD
fn foo() -> Result<(), ()> {
    if condition {
        Err(())?;
    }
    Ok(())
}
Rationale: return has type !, which allows the compiler to flag dead
code (Err(...)? is of unconstrained generic type T).
Comparisons
When doing multiple comparisons use </<=, avoid >/>=.
// GOOD
assert!(lo <= x && x <= hi);
assert!(r1 < l2 || r2 < l1);
assert!(x < y);
assert!(0 < x);

// BAD
assert!(x >= lo && x <= hi);
assert!(r1 < l2 || l1 > r2);
assert!(y > x);
assert!(x > 0);
Rationale: Less-then comparisons are more intuitive; they correspond spatially to real line.
if-let
Avoid if let ... { } else { } construct; prefer match.
// GOOD
match context.expected_type.as_ref() {
    Some(expected_type) => completion_ty == expected_type && !expected_type.is_unit(),
    None => false,
}

// BAD
if let Some(expected_type) = context.expected_type.as_ref() {
    completion_ty == expected_type && !expected_type.is_unit()
} else {
    false
}
Rationale: match is almost always more compact.
The else branch can get a more precise pattern: None or Err(_) instead of _.
Match Ergonomics
Do not use the ref keyword.
Rationale: consistency & simplicity.
ref was required before match ergonomics.
Today, it is redundant.
Between ref and mach ergonomics, the latter is more ergonomic in most cases, and is simpler (does not require a keyword).
Empty Match Arms
Use => (), when a match arm is intentionally empty:
// GOOD
match result {
    Ok(_) => (),
    Err(error) => error!("{}", error),
}

// BAD
match result {
    Ok(_) => {}
    Err(error) => error!("{}", error),
}
Rationale: consistency.
Functional Combinators
Use high order monadic combinators like map, then when they are a natural choice; do not bend the code to fit into some combinator.
If writing a chain of combinators creates friction, replace them with control flow constructs: for, if, match.
Mostly avoid bool::then and Option::filter.
// GOOD
if !x.cond() {
    return None;
}
Some(x)

// BAD
Some(x).filter(|it| it.cond())
This rule is more "soft" then others, and boils down mostly to taste.
The guiding principle behind this rule is that code should be dense in computation, and sparse in the number of expressions per line.
The second example contains less computation -- the filter function is an indirection for if, it does not do any useful work by itself.
At the same time, it is more crowded -- it takes more time to visually scan it.
Rationale: consistency, playing to languages' strengths.
Rust has first-class support for imperative control flow constructs
like for and if, while functions are less first-class due to lack
of universal function type, currying, and non-first-class effects (?, .await).
Turbofish
Prefer type ascription over the turbofish.
When ascribing types, avoid _
// GOOD
let mutable: Vec<T> = old.into_iter().map(|it| builder.make_mut(it)).collect();

// BAD
let mutable: Vec<_> = old.into_iter().map(|it| builder.make_mut(it)).collect();

// BAD
let mutable = old.into_iter().map(|it| builder.make_mut(it)).collect::<Vec<_>>();
Rationale: consistency, readability. If compiler struggles to infer the type, the human would as well. Having the result type specified up-front helps with understanding what the chain of iterator methods is doing.
Helper Functions
Avoid creating single-use helper functions:
// GOOD
let buf = {
    let mut buf = get_empty_buf(&mut arena);
    buf.add_item(item);
    buf
};

// BAD
let buf = prepare_buf(&mut arena, item);

...

fn prepare_buf(arena: &mut Arena, item: Item) -> ItemBuf {
    let mut result = get_empty_buf(&mut arena);
    result.add_item(item);
    result
}
Exception: if you want to make use of return or ?.
Rationale: single-use functions change frequently, adding or removing parameters adds churn. A block serves just as well to delineate a bit of logic, but has access to all the context. Re-using originally single-purpose function often leads to bad coupling.
Local Helper Functions
Put nested helper functions at the end of the enclosing functions (this requires using return statement). Do not nest more than one level deep.
// GOOD
fn dfs(graph: &Graph, v: Vertex) -> usize {
    let mut visited = FxHashSet::default();
    return go(graph, &mut visited, v);

    fn go(graph: &Graph, visited: &mut FxHashSet<Vertex>, v: usize) -> usize {
        ...
    }
}

// BAD
fn dfs(graph: &Graph, v: Vertex) -> usize {
    fn go(graph: &Graph, visited: &mut FxHashSet<Vertex>, v: usize) -> usize {
        ...
    }

    let mut visited = FxHashSet::default();
    go(graph, &mut visited, v)
}
Rationale: consistency, improved top-down readability.
Helper Variables
Introduce helper variables freely, especially for multiline conditions:
// GOOD
let wgslfmt_not_installed =
    captured_stderr.contains("not installed") || captured_stderr.contains("not available");

match output.status.code() {
    Some(1) if !wgslfmt_not_installed => Ok(None),
    _ => Err(format_err!("wgslfmt failed:\n{}", captured_stderr)),
};

// BAD
match output.status.code() {
    Some(1)
        if !captured_stderr.contains("not installed")
           && !captured_stderr.contains("not available") => Ok(None),
    _ => Err(format_err!("wgslfmt failed:\n{}", captured_stderr)),
};
Rationale: Like blocks, single-use variables are a cognitively cheap abstraction, as they have access to all the context.
Extra variables help during debugging, they make it easy to print/view important intermediate results.
Giving a name to a condition inside an if expression often improves clarity and leads to nicely formatted code.
Token names
Use T![foo] instead of SyntaxKind::FOO_KW.
// GOOD
match p.current() {
    T![true] | T![false] => true,
    _ => false,
}

// BAD
match p.current() {
    SyntaxKind::TRUE_KW | SyntaxKind::FALSE_KW => true,
    _ => false,
}
Rationale: The macro uses the familiar Rust syntax, avoiding ambiguities like "is this a brace or bracket?".
Documentation
Style inline code comments as proper sentences. Start with a capital letter, end with a dot.
// GOOD

// Only simple single segment paths are allowed.
MergeBehavior::Last => {
    tree.use_tree_list().is_none() && tree.path().map(path_len) <= Some(1)
}

// BAD

// only simple single segment paths are allowed
MergeBehavior::Last => {
    tree.use_tree_list().is_none() && tree.path().map(path_len) <= Some(1)
}
Rationale: writing a sentence (or maybe even a paragraph) rather just "a comment" creates a more appropriate frame of mind. It tricks you into writing down more of the context you keep in your head while coding.
For .md files, prefer a sentence-per-line format, do not wrap lines.
If the line is too long, you might want to split the sentence in two.
Rationale: much easier to edit the text and read the diff, see this link.
Syntax in wgsl-analyzer
About the guide
This guide describes the current state of syntax trees and parsing in wgsl-analyzer as of 2020-01-09 (link to commit).
Source Code
The things described are implemented in three places:
- rowan -- a generic library for rowan syntax trees.
- syntax crate inside rust-analyzer which wraps
rowaninto rust-analyzer specific API. Nothing in rust-analyzer except this crate knows aboutrowan. - parser crate parses input tokens into a
syntaxtree.
Design Goals
- Syntax trees are lossless, or full fidelity. All comments and whitespace get preserved.
- Syntax trees are semantic-less. They describe strictly the structure of a sequence of characters, they do not have hygiene, name resolution, or type information attached.
- Syntax trees are simple value types. It is possible to create trees for a syntax without any external context.
- Syntax trees have intuitive traversal API (parent, children, siblings, etc).
- Parsing is lossless (even if the input is invalid, the tree produced by the parser represents it exactly).
- Parsing is resilient (even if the input is invalid, the parser tries to see as many syntax tree fragments in the input as it can).
- Performance is important, it is OK to use
unsafeif it means better memory/cpu usage. - Keep the parser and the syntax tree isolated from each other, such that they can vary independently.
Trees
Overview
The syntax tree consists of three layers:
- GreenNodes
- SyntaxNodes (aka RedNode)
- AST
Of these, only GreenNodes store the actual data, the other two layers are (non-trivial) views into the green tree.
Red-green terminology comes from Roslyn and gives the name to the rowan library.
Green and syntax nodes are defined in rowan, ast is defined in wgsl-analyzer.
Syntax trees are a semi-transient data structure. In general, the frontend does not keep syntax trees for all files in memory. Instead, it lowers syntax trees to a more compact and rigid representation, which is not full-fidelity, but which can be mapped back to a syntax tree if so desired.
GreenNode
GreenNode is a purely-functional tree with arbitrary arity. Conceptually, it is equivalent to the following run-of-the-mill struct:
#[derive(PartialEq, Eq, Clone, Copy)]
struct SyntaxKind(u16);

#[derive(PartialEq, Eq, Clone)]
struct Node {
    kind: SyntaxKind,
    text_len: usize,
    children: Vec<Arc<Either<Node, Token>>>,
}

#[derive(PartialEq, Eq, Clone)]
struct Token {
    kind: SyntaxKind,
    text: String,
}
All the differences between the above sketch and the real implementation are strictly due to optimizations.
Points of note:
- The tree is untyped. Each node has a "type tag",
SyntaxKind. - Interior and leaf nodes are distinguished on the type level.
- Trivia and non-trivia tokens are not distinguished on the type level.
- Each token carries its full text.
- The original text can be recovered by concatenating the texts of all tokens in order.
- Accessing a child of a particular type (for example, the parameter list of a function) generally involves linearly traversing the children, looking for a specific
kind. - Modifying the tree is roughly
O(depth). We do not make special efforts to guarantee that the depth is not linear, but, in practice, syntax trees are branchy and shallow. - If a mandatory (grammar-wise) node is missing from the input, it is just missing from the tree.
- If extra erroneous input is present, it is wrapped into a node with
ERRORkind and treated just like any other node. - Parser errors are not a part of the syntax tree.
An input like fn foo() -> i32 { return 90 + 2; } might be parsed as:
Function@0..34
  Fn@0..2 "fn"
  Blankspace@2..3 " "
  Name@3..6
    Identifier@3..6 "foo"
  ParameterList@6..9
    ParenthesisLeft@6..7 "("
    ParenthesisRight@7..8 ")"
    Blankspace@8..9 " "
  ReturnType@9..16
    Arrow@9..11 "->"
    Blankspace@11..12 " "
    Int32@12..16
      Int32@12..15 "i32"
      Blankspace@15..16 " "
  CompoundStatement@16..34
    BraceLeft@16..17 "{"
    Blankspace@17..18 " "
    ReturnStatement@18..31
      Return@18..24 "return"
      Blankspace@24..25 " "
      InfixExpression@25..31
        Literal@25..28
          DecimalIntLiteral@25..27 "90"
          Blankspace@27..28 " "
        Plus@28..29 "+"
        Blankspace@29..30 " "
        Literal@30..31
          DecimalIntLiteral@30..31 "2"
    Semicolon@31..32 ";"
    Blankspace@32..33 " "
    BraceRight@33..34 "}"
Optimizations
A significant amount of implementation work here was done by CAD97.
To reduce the number of allocations, the GreenNode is a DST, which uses a single allocation for the header and children. Thus, it is only usable behind a pointer.
*-----------+------+----------+------------+--------+--------+-----+--------*
| ref_count | kind | text_len | n_children | child1 | child2 | ... | childn |
*-----------+------+----------+------------+--------+--------+-----+--------*
To more compactly store the children, we box both interior nodes and tokens, and represent Either<Arc<Node>, Arc<Token>> as a single pointer with a tag in the last bit.
To avoid allocating EVERY SINGLE TOKEN on the heap, syntax trees use interning.
Because the tree is fully immutable, it is valid to structurally share subtrees.
For example, in 1 + 1, there will be a single token for 1 with ref count 2; the same goes for the whitespace token.
Interior nodes are shared as well (for example, in (1 + 1) * (1 + 1)).
Note that the result of the interning is an Arc<Node>.
That is, it is not an index into the interning table, so you do not have to have the table around to do anything with the tree.
Each tree is fully self-contained (although different trees might share parts).
Currently, the interner is created per-file, but it will be easy to use a per-thread or per-some-context one.
We use a TextSize, a newtyped u32, to store the length of the text.
We currently use SmolStr, a small object optimized string to store text.
This was mostly relevant before we implemented tree interning, to avoid allocating common keywords and identifiers. We should switch to storing text data alongside the interned tokens.
GreenNode Alternative designs
Dealing with trivia
In the above model, whitespace is not treated specially. Another alternative (used by Swift and Roslyn) is to explicitly divide the set of tokens into trivia and non-trivia tokens, and represent non-trivia tokens as:
struct Token {
  kind: NonTriviaTokenKind,
  text: String,
  leading_trivia: Vec<TriviaToken>,
  trailing_trivia: Vec<TriviaToken>,
}
The tree then contains only non-trivia tokens.
Another approach (from Dart) is to, in addition to a syntax tree, link all the tokens into a bidirectional linked list. That way, the tree again contains only non-trivia tokens.
Explicit trivia nodes, like in rowan, are used by IntelliJ.
Accessing Children
As noted before, accessing a specific child in the node requires a linear traversal of the children (though we can skip tokens, because the tag is encoded in the pointer itself).
It is possible to recover O(1) access with another representation.
We explicitly store optional and missing (required by the grammar, but not present) nodes.
That is, we use Option<Node> for children.
We also remove trivia tokens from the tree.
This way, each child kind generally occupies a fixed position in a parent, and we can use index access to fetch it.
The cost is that we now need to allocate space for all not-present optional nodes.
So, fn foo() {} will have slots for visibility, unsafeness, attributes, abi, and return type.
IntelliJ uses linear traversal.
Roslyn and Swift do O(1) access.
Mutable Trees
IntelliJ uses mutable trees. Overall, it creates a lot of additional complexity. However, the API for editing syntax trees is nice.
For example, the assist to move generic bounds to the where clause has this code:
for typeBound in typeBounds {
  typeBound.typeParamBounds?.delete()
}
Modeling this with immutable trees is possible, but annoying.
Syntax Nodes
A function green tree is not super-convenient to use.
The biggest problem is accessing parents (there are no parent pointers!).
But there are also "identity" issues.
Let us say you want to write code that builds a list of expressions in a file: fn collect_expressions(file: GreenNode) -> HashSet<GreenNode>.
For input like:
fn main() {
  let x = 90i8;
  let x = x + 2;
  let x = 90i64;
  let x = x + 2;
}
both copies of the x + 2 expression are represented by equal (and, with interning in mind, actually the same) green nodes.
Green trees just cannot differentiate between the two.
SyntaxNode adds parent pointers and identity semantics to green nodes.
They can be called cursors or zippers (fun fact: a zipper is a derivative (as in ′) of a data structure).
Conceptually, a SyntaxNode looks like this:
type SyntaxNode = Arc<SyntaxData>;

struct SyntaxData {
  offset: usize,
  parent: Option<SyntaxNode>,
  green: Arc<GreenNode>,
}

impl SyntaxNode {
  fn new_root(root: Arc<GreenNode>) -> SyntaxNode {
    Arc::new(SyntaxData {
      offset: 0,
      parent: None,
      green: root,
    })
  }
  fn parent(&self) -> Option<SyntaxNode> {
    self.parent.clone()
  }
  fn children(&self) -> impl Iterator<Item = SyntaxNode> {
    let mut offset = self.offset;
    self.green.children().map(|green_child| {
      let child_offset = offset;
      offset += green_child.text_len;
      Arc::new(SyntaxData {
        offset: child_offset,
        parent: Some(Arc::clone(self)),
        green: Arc::clone(green_child),
      })
    })
  }
}

impl PartialEq for SyntaxNode {
  fn eq(&self, other: &SyntaxNode) -> bool {
    self.offset == other.offset
      && Arc::ptr_eq(&self.green, &other.green)
  }
}
Points of note:
- SyntaxNode remembers its parent node (and, transitively, the path to the root of the tree).
- SyntaxNode knows its absolute text offset in the whole file.
- Equality is based on identity. Comparing nodes from different trees does not make sense.
Optimization
The reality is different though. Traversal of trees is a common operation, and it makes sense to optimize it. In particular, the above code allocates and does atomic operations during a traversal.
To get rid of atomics, rowan uses non-thread-safe Rc.
This is OK because tree traversals mostly (always, in the case of wgsl-analyzer) run on a single thread.
If you need to send a SyntaxNode to another thread, you can send a pair of rootGreenNode (which is thread-safe) and a Range<usize>.
The other thread can restore the SyntaxNode by traversing from the root green node and looking for a node with the specified range.
You can also use a similar trick to store a SyntaxNode.
That is, a data structure that holds a (GreenNode, Range<usize>) will be Sync.
However, wgsl-analyzer goes even further.
It treats trees as semi-transient and instead of storing a GreenNode, it generally stores just the id of the file from which the tree originated: (FileId, Range<usize>).
The SyntaxNode is restored by reparsing the file and traversing it from the root.
With this trick, wgsl-analyzer holds only a small number of trees in memory at the same time, which reduces memory usage.
Additionally, only the root SyntaxNode owns an Arc to the (root) GreenNode.
All other SyntaxNodes point to corresponding GreenNodes with a raw pointer.
They also point to the parent (and, consequently, to the root) with an owning Rc, so this is sound.
In other words, one needs one arc bump when initiating a traversal.
To get rid of allocations, rowan takes advantage of SyntaxNode: !Sync and uses a thread-local free list of SyntaxNodes.
In a typical traversal, you only directly hold a few SyntaxNodes at a time (and their ancestors indirectly).
A free list proportional to the depth of the tree removes all allocations in a typical case.
So, while traversal is not exactly incrementing a pointer, it is still pretty cheap: TLS + rc bump!
Traversal also yields (cheap) owned nodes, which improves ergonomics quite a bit.
Syntax Nodes Alternative Designs
Memoized RedNodes
C# and Swift follow the design where the red nodes are memoized, which would look roughly like this in Rust:
type SyntaxNode = Arc<SyntaxData>;

struct SyntaxData {
  offset: usize,
  parent: Option<SyntaxNode>,
  green: Arc<GreenNode>,
  children: Vec<OnceCell<SyntaxNode>>,
}
This allows using true pointer equality for comparison of identities of SyntaxNodes.
wgsl-analyzer used to have this design as well, but we have since switched to cursors.
The main problem with memoizing the red nodes is that it more than doubles the memory requirements for fully realized syntax trees.
In contrast, cursors generally retain only a path to the root.
C# combats increased memory usage by using weak references.
AST
GreenTrees are untyped and homogeneous, because it makes accommodating error nodes, arbitrary whitespace, and comments natural, and because it makes it possible to write generic tree traversals.
However, when working with a specific node, like a function definition, one would want a strongly typed API.
This is what is provided by the AST layer. AST nodes are transparent wrappers over untyped syntax nodes:
pub trait AstNode {
  fn cast(syntax: SyntaxNode) -> Option<Self>
  where
    Self: Sized;

  fn syntax(&self) -> &SyntaxNode;
}
Concrete nodes are generated (there are 117 of them), and look roughly like this:
#[derive(Debug, Clone, PartialEq, Eq, Hash)]
pub struct FnDef {
  syntax: SyntaxNode,
}

impl AstNode for FnDef {
  fn cast(syntax: SyntaxNode) -> Option<Self> {
    match kind {
      FN => Some(FnDef { syntax }),
      _ => None,
    }
  }
  fn syntax(&self) -> &SyntaxNode {
    &self.syntax
  }
}

impl FnDef {
  pub fn param_list(&self) -> Option<ParamList> {
    self.syntax.children().find_map(ParamList::cast)
  }
  pub fn ret_type(&self) -> Option<RetType> {
    self.syntax.children().find_map(RetType::cast)
  }
  pub fn body(&self) -> Option<BlockExpr> {
    self.syntax.children().find_map(BlockExpr::cast)
  }
  // ...
}
Variants like expressions, patterns, or items are modeled with enums, which also implement AstNode:
#[derive(Debug, Clone, PartialEq, Eq, Hash)]
pub enum AssocItem {
  FnDef(FnDef),
  TypeAliasDef(TypeAliasDef),
  ConstDef(ConstDef),
}

impl AstNode for AssocItem {
  ...
}
Shared AST substructures are modeled via (dynamically compatible) traits:
trait HasVisibility: AstNode {
  fn visibility(&self) -> Option<Visibility>;
}

impl HasVisibility for FnDef {
  fn visibility(&self) -> Option<Visibility> {
    self.syntax.children().find_map(Visibility::cast)
  }
}
Points of note:
- Like
SyntaxNodes, AST nodes are cheap to clone pointer-sized owned values. - All "fields" are optional, to accommodate incomplete and/or erroneous source code.
- It is always possible to go from an ast node to an untyped
SyntaxNode. - It is possible to go in the opposite direction with a checked cast.
enums allow modeling of arbitrary intersecting subsets of AST types.- Most of wgsl-analyzer works with the ast layer, with notable exceptions of:
- macro expansion, which needs access to raw tokens and works with
SyntaxNodes - some IDE-specific features like syntax highlighting are more conveniently implemented over a homogeneous
SyntaxNodetree
- macro expansion, which needs access to raw tokens and works with
AST Alternative Designs
Semantic Full AST
In IntelliJ, the AST layer (dubbed Program Structure Interface) can have semantics attached, and is usually backed by either a syntax tree, indices, or metadata from compiled libraries. The backend for PSI can change dynamically.
Syntax Tree Recap
At its core, the syntax tree is a purely functional n-ary tree, which stores text at the leaf nodes and node "kinds" at all nodes.
A cursor layer is added on top, which gives owned, cheap to clone nodes with identity semantics, parent links, and absolute offsets.
An AST layer is added on top, which reifies each node Kind as a separate Rust type with the corresponding API.
Parsing
The (green) tree is constructed by a DFS "traversal" of the desired tree structure:
pub struct GreenNodeBuilder { ... }

impl GreenNodeBuilder {
    pub fn new() -> GreenNodeBuilder { ... }

    pub fn token(&mut self, kind: SyntaxKind, text: &str) { ... }

    pub fn start_node(&mut self, kind: SyntaxKind) { ... }
    pub fn finish_node(&mut self) { ... }

    pub fn finish(self) -> GreenNode { ... }
}
The parser, ultimately, needs to invoke the GreenNodeBuilder.
There are two principal sources of inputs for the parser:
- source text, which contains trivia tokens (whitespace and comments)
- token trees from macros, which lack trivia
Additionally, input tokens do not correspond 1-to-1 with output tokens.
For example, two consecutive > tokens might be glued, by the parser, into a single >>.
For these reasons, the parser crate defines a callback interfaces for both input tokens and output trees. The explicit glue layer then bridges various gaps.
The parser interface looks like this:
pub struct Token {
    pub kind: SyntaxKind,
    pub is_joined_to_next: bool,
}

pub trait TokenSource {
    fn current(&self) -> Token;
    fn lookahead_nth(&self, n: usize) -> Token;
    fn is_keyword(&self, kw: &str) -> bool;

    fn bump(&mut self);
}

pub trait TreeSink {
    fn token(&mut self, kind: SyntaxKind, n_tokens: u8);

    fn start_node(&mut self, kind: SyntaxKind);
    fn finish_node(&mut self);

    fn error(&mut self, error: ParseError);
}

pub fn parse(
    token_source: &mut dyn TokenSource,
    tree_sink: &mut dyn TreeSink,
) { ... }
Points of note:
- The parser and the syntax tree are independent, they live in different crates neither of which depends on the other.
- The parser does not know anything about textual contents of the tokens, with an isolated hack for checking contextual keywords.
- For gluing tokens, the
TreeSink::tokenmight advance further than one atomic token ahead.
Reporting Syntax Errors
Syntax errors are not stored directly in the tree.
The primary motivation for this is that syntax tree is not necessary produced by the parser, it may also be assembled manually from pieces (which happens all the time in refactorings).
Instead, parser reports errors to an error sink, which stores them in a Vec.
If possible, errors are not reported during parsing and are postponed for a separate validation step.
For example, parser accepts visibility modifiers on trait methods, but then a separate tree traversal flags all such visibilities as erroneous.
Macros
The primary difficulty with macros is that individual tokens have identities, which need to be preserved in the syntax tree for hygiene purposes.
This is handled by the TreeSink layer.
Specifically, TreeSink constructs the tree in lockstep with draining the original token stream.
In the process, it records which tokens of the tree correspond to which tokens of the input, by using text ranges to identify syntax tokens.
The end result is that parsing an expanded code yields a syntax tree and a mapping of text-ranges of the tree to original tokens.
To deal with precedence in cases like $expression * 1, we use special invisible parenthesis, which are explicitly handled by the parser.
Whitespace & Comments
Parser does not see whitespace nodes.
Instead, they are attached to the tree in the TreeSink layer.
For example, in
// non doc comment
fn foo() {}
the comment will be (heuristically) made a child of function node.
Incremental Reparse
Green trees are cheap to modify, so incremental reparse works by patching a previous tree, without maintaining any additional state.
The reparse is based on heuristic: we try to contain a change to a single {} block, and reparse only this block.
To do this, we maintain the invariant that, even for invalid code, curly braces are always paired correctly.
In practice, incremental reparsing does not actually matter much for IDE use-cases, parsing from scratch seems to be fast enough.
Parsing Algorithm
We use a boring hand-crafted recursive descent + pratt combination, with a special effort of continuing the parsing if an error is detected.
Parser Recap
Parser itself defines traits for token sequence input and syntax tree output. It does not care about where the tokens come from, and how the resulting syntax tree looks like.